Drone-based Sorghum Height Estimation and Plant Modeling
Sorghum is a critical crop for food production in arid climates due to its natural drought and heat tolerance. To improve yields in these challenging environments, researchers need high-throughput methods to monitor plant development and optimize cultivars. One of the most significant indicators of yield is plant height, which directly reflects growth rates and responses to environmental treatments.
This post details a workflow for using drone-based Structure from Motion (SfM) technology to estimate sorghum height and develop growth models based on Growing Degree Days (GDD).
Drone Data Acquisition
For this study, we conducted experiments at the UC Davis experimental field during the summer of 2022. The field spanned 265 feet by 45 feet, arranged into 18 beds across 18 rows.
Data was collected using a DJI Phantom 4 Pro drone. The flight path was generated via Mission Planner and executed through Litchi software at a height of 5 meters above ground level.
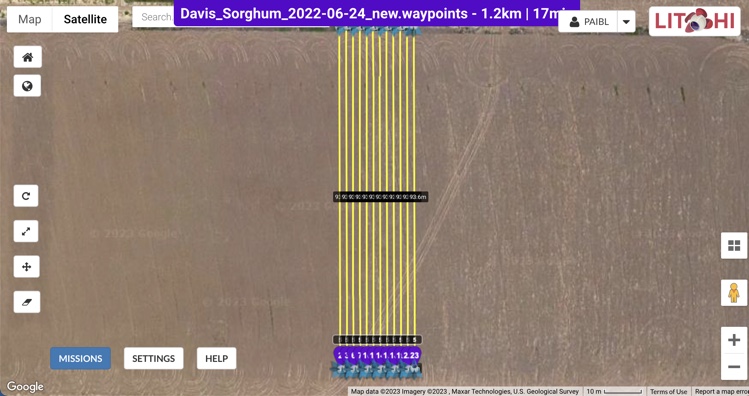
Over the course of the season, 11 separate flight missions were conducted, capturing standard RGB images for SfM processing.
3D Reconstruction and Height Extraction
We processed the captured imagery using Agisoft Metashape 1.8.6. The processing pipeline involved aligning photos, building dense clouds, and generating orthomosaics and Digital Elevation Models (DEMs).
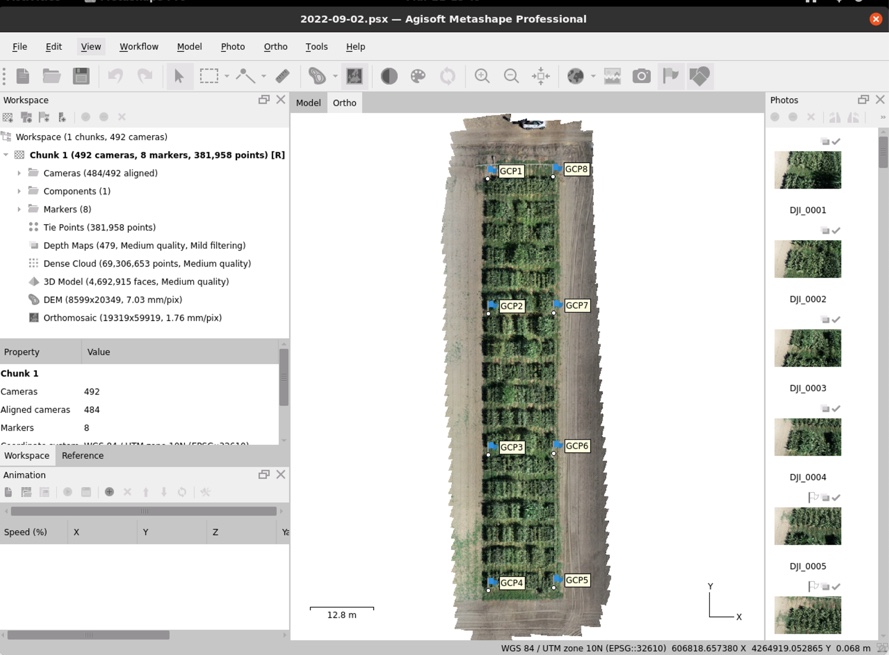
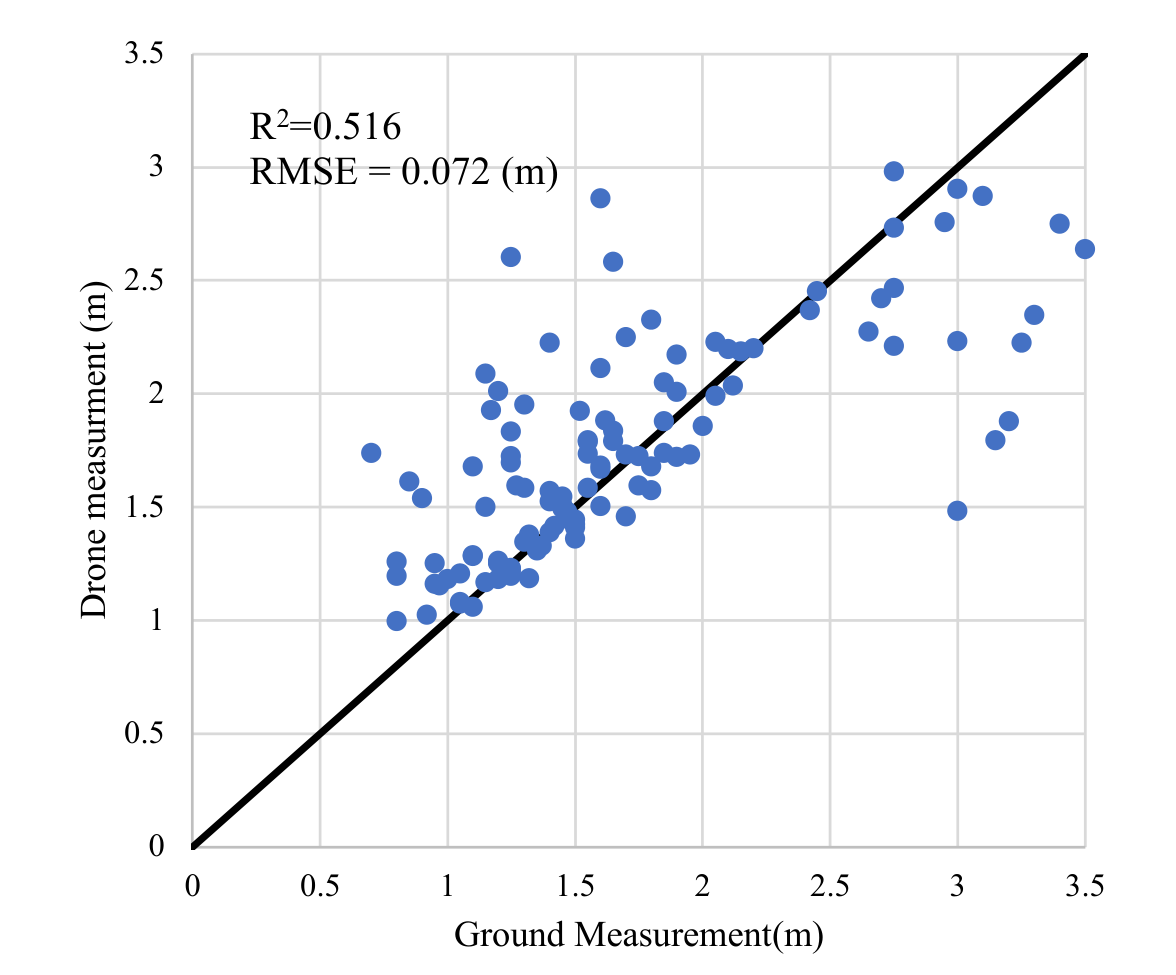
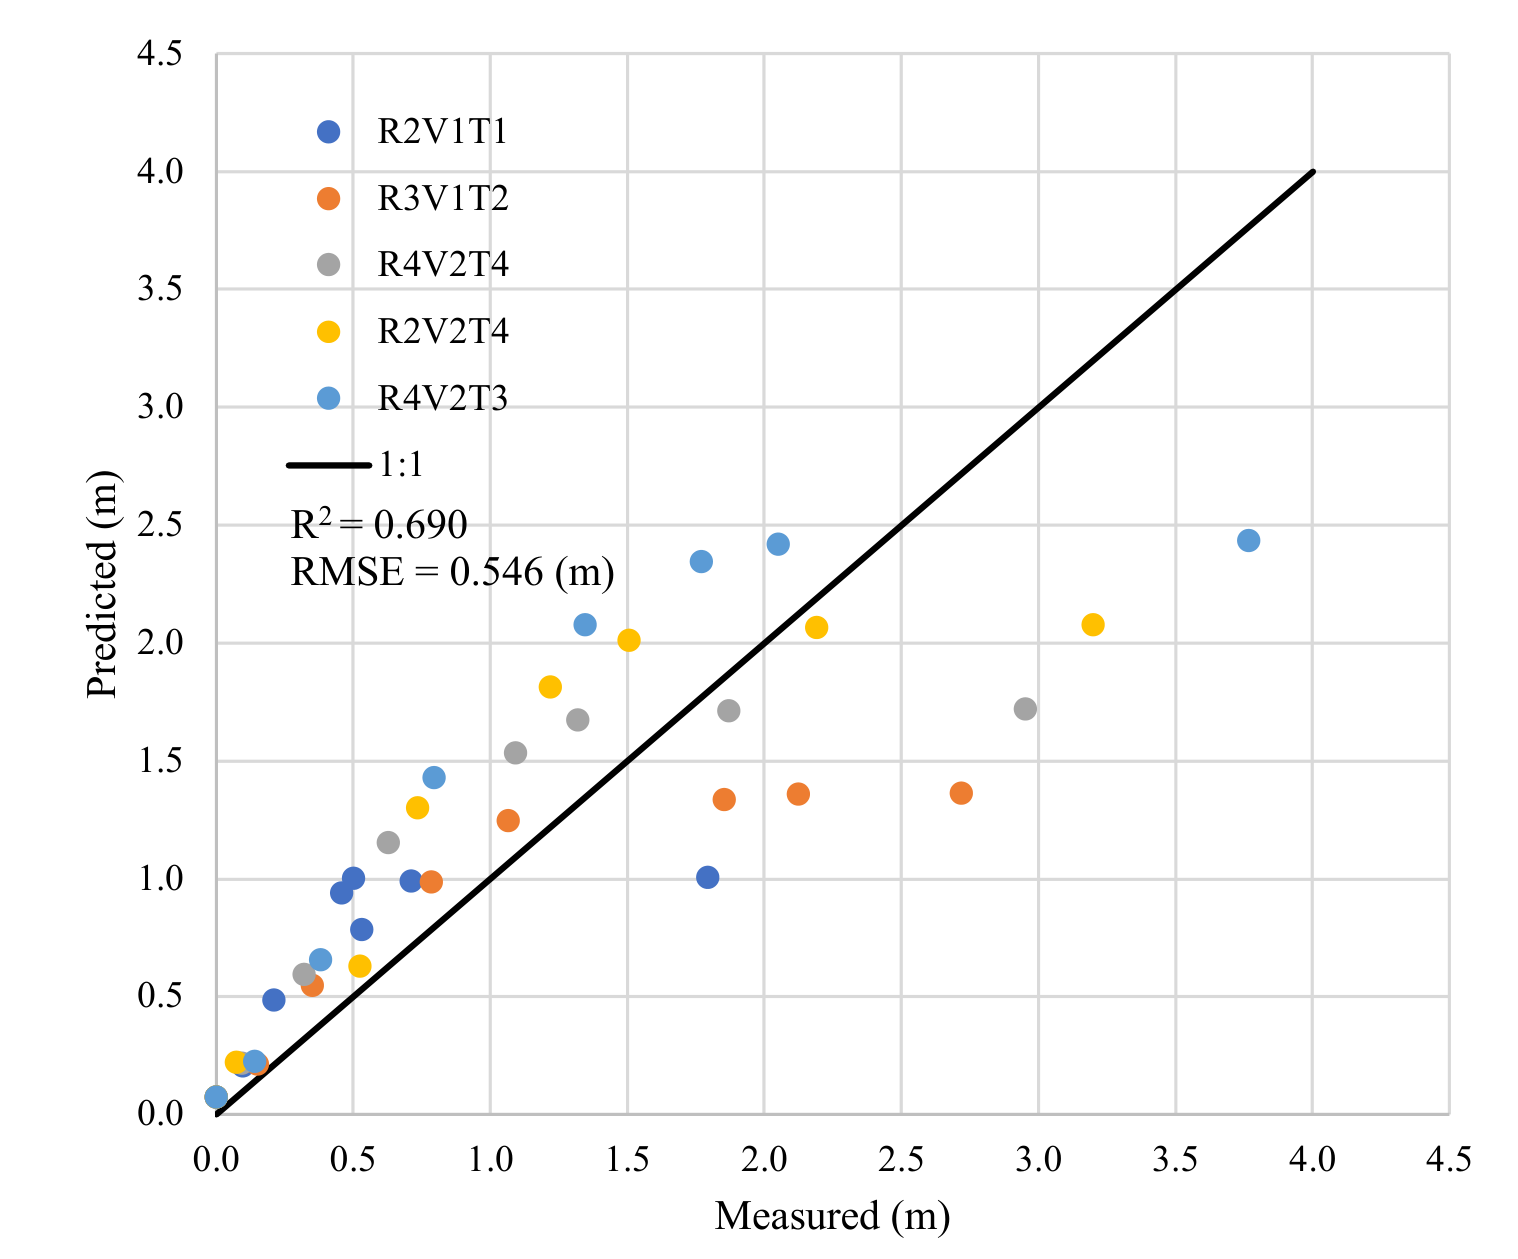
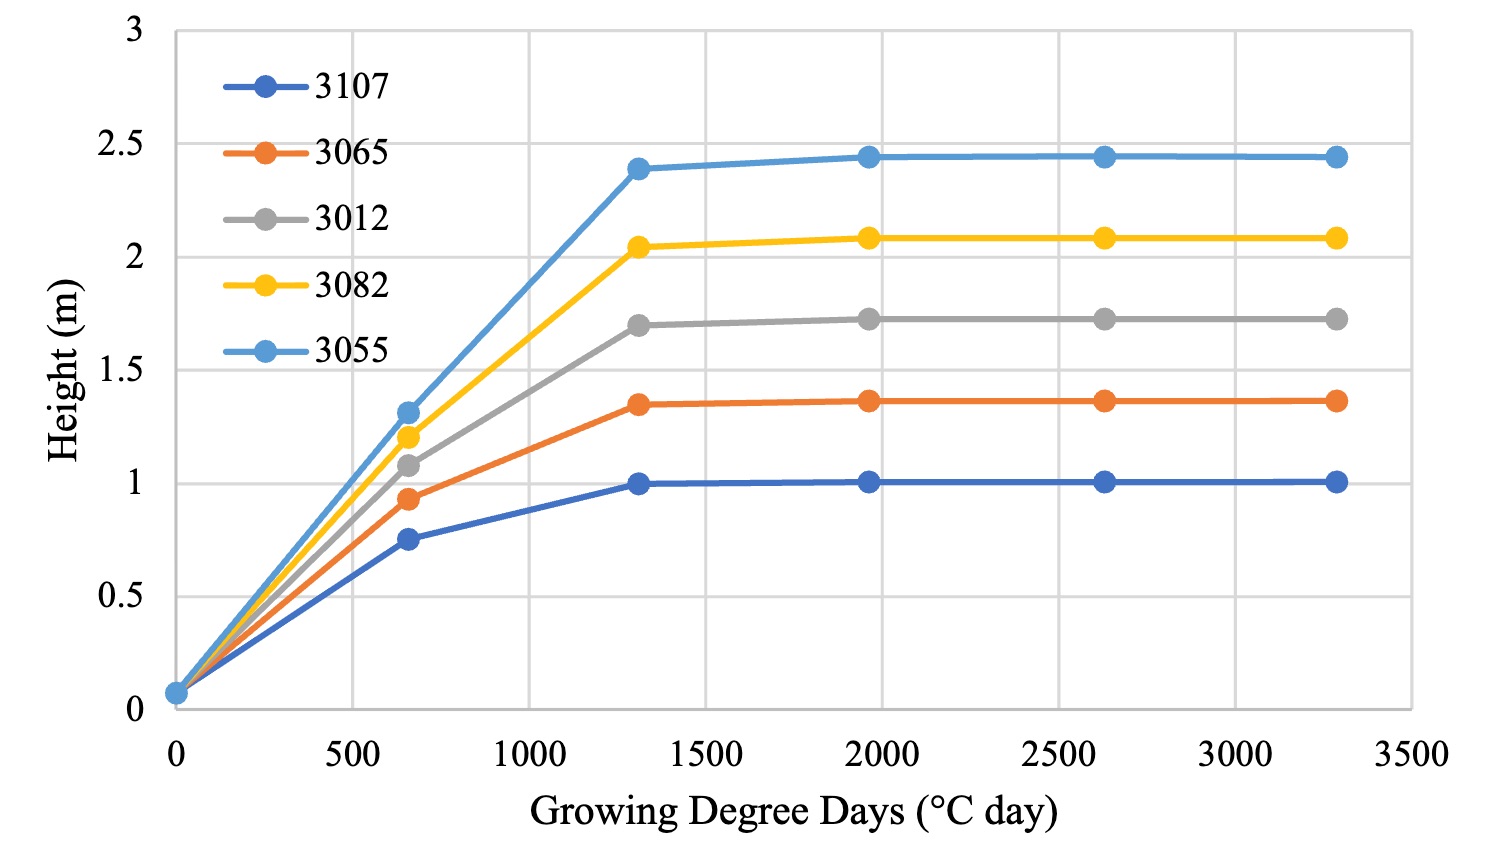
To extract plant height from the DEM, we utilized Python for automated plot segmentation. The Cumulative Probability Distribution (CPD) of heights within each plot was calculated. We recorded the 99th percentile height as the representative height for each genotype, minimizing noise from outlier points.
Modeling Growth via Growing Degree Days
The extracted height data was modeled against environmental data collected from the CIMIS Weather Station #6. We used a base temperature of 8°C to calculate Growing Degree Days (GDD).
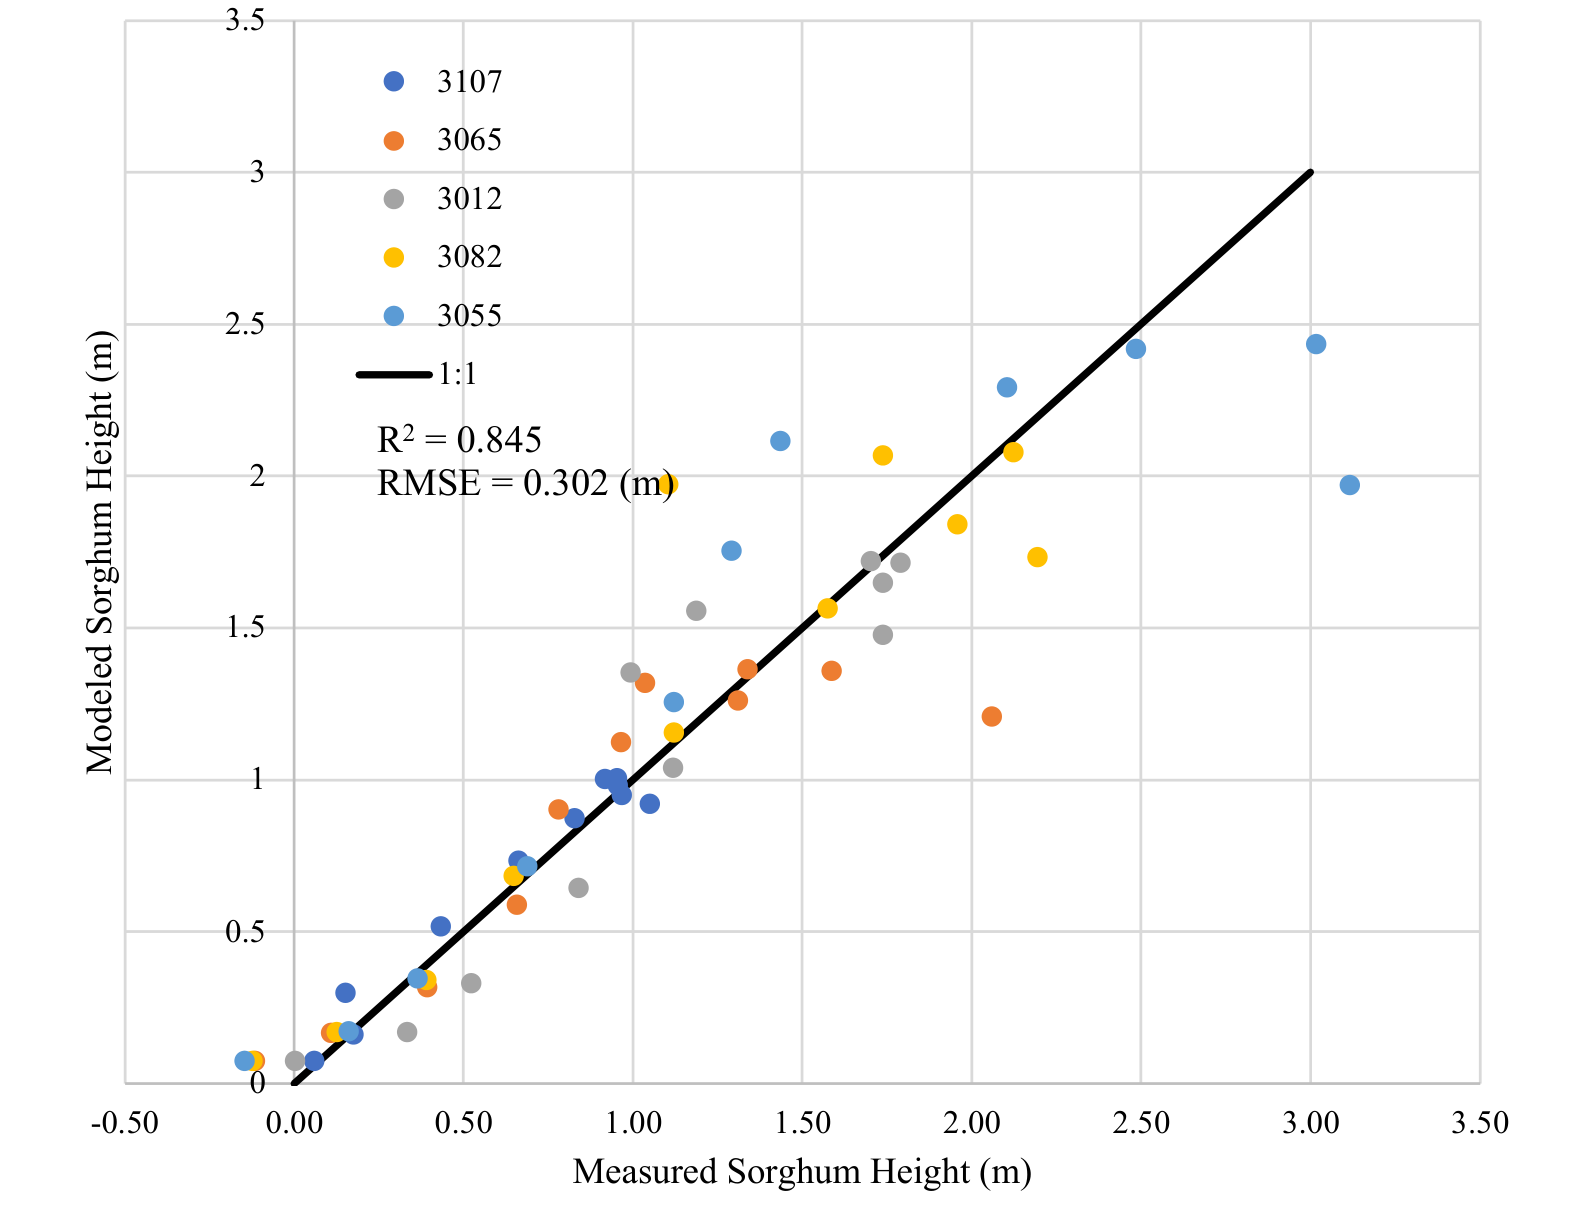
The relationship between GDD and crop height was modeled using a sigmoidal growth function. According to the empirical formula, sorghum height can be modeled using Growing Degree Days (GDD) and Sigmoid functions:
\[y(GDD, p) = \frac{y_0 y_{max}}{y_0 + (y_{max} - y_0)\exp(-k \cdot GDD)}\]The sorghum height model is optimized so that the $R^2$ of the modeled value $\hat{y}_i$ and the observed value $y_i$ is maximized:
\[R^2 = 1 - \frac{\sum_{i=1}^n (y_i - \hat{y}_i)^2}{\sum_{i=1}^n (y_i - \bar{y})^2}\]This optimization approach ensures that the model captures the characteristic S-shaped growth curve of the sorghum genotypes while minimizing the residual error across the multi-temporal dataset.
Validation and Application to Different Climates
The developed model was validated using an independent dataset from North Carolina A&T State University (2011).
Finally, we applied the model to climate data from Kaolack, Senegal, to predict growth patterns in West African environments.
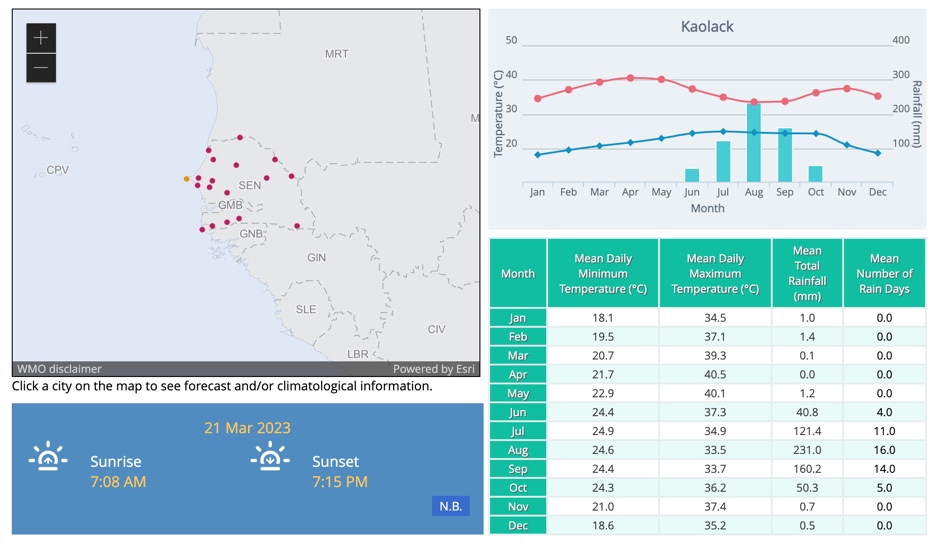
The model predicts that sorghum in this region will reach its maximum height approximately two months after planting, which aligns with local harvesting calendars.
According to the USDA International Production Assessment Division, sorghum in the Senegal region begins cultivation in mid-June and is harvested after September [3]. Therefore, Growing Degree Days were calculated using the average value of the minimum and maximum temperatures from June 15 to November 15.
This demonstrates the potential of combining drone-based phenotyping with biophysical modeling to support breeding programs in food-insecure regions.
Links & Resources
- Project Website: G×E×M Innovation in Intelligence for climate adaptation
References
- 1. Brian Bailey. Plant and crop systems modeling. 2023.
- 2. Ashwin Kumar Devudigari. Sweet sorghum production based on fertilizer rates, varieties and use of grain sorghum model. 2011.
- 3. USDA IPAD. Senegal sorghum area, yield and production. retrieved march 22, 2023, from USDA IPAD.
- 4. World Meteorological Organization. World weather information service. retrieved march 22, 2023, from WMO World Weather.
BibTeX Citation
Academic Attribution:
@article{yun2026sorghum,
  title={Drone-based Sorghum Height Estimation and Plant Modeling},
  author={Yun, Heesup},
  journal={PLS123 Plant and Crop Systems Modeling, WQ2023, UCDavis},
  year={2023},
  url={https://heesup.github.io/assets/docs/2023WQ_PLS123_Heesup_FinalProject_Report.pdf}
}