Spectral Response Characterization of an NIR-Modified Consumer Camera for UAV Radiometric Calibration
Introduction
Consumer cameras can be converted to NIR imaging by removing the internal IR-blocking filter and adding a red-blocking filter in front of the lens. This unlocks near-infrared sensitivity for vegetation analysis on UAV platforms — but it comes at a cost: the modified optical path renders the manufacturer’s assumed spectral response invalid. Without re-characterizing the camera’s actual sensitivity, derived reflectance values will be systematically wrong.
This post documents how we addressed this by empirically recovering the spectral response of an NIR-modified Canon SX260, alongside an unmodified Canon S110 (RGB), and using both to perform radiometric calibration of UAV imagery. Two calibration steps are covered:
- Spectral response characterization — recovering each channel’s wavelength sensitivity curve from a color checker and spectrometer measurements
- Radiometric calibration — mapping per-flight DN values to known surface reflectance via ground reference panels
The approach follows Jiang et al. (2013) and is especially critical for NIR-converted cameras where spectral sensitivity can differ substantially from the stock sensor.
1. Camera Spectral Response Identification
Cameras
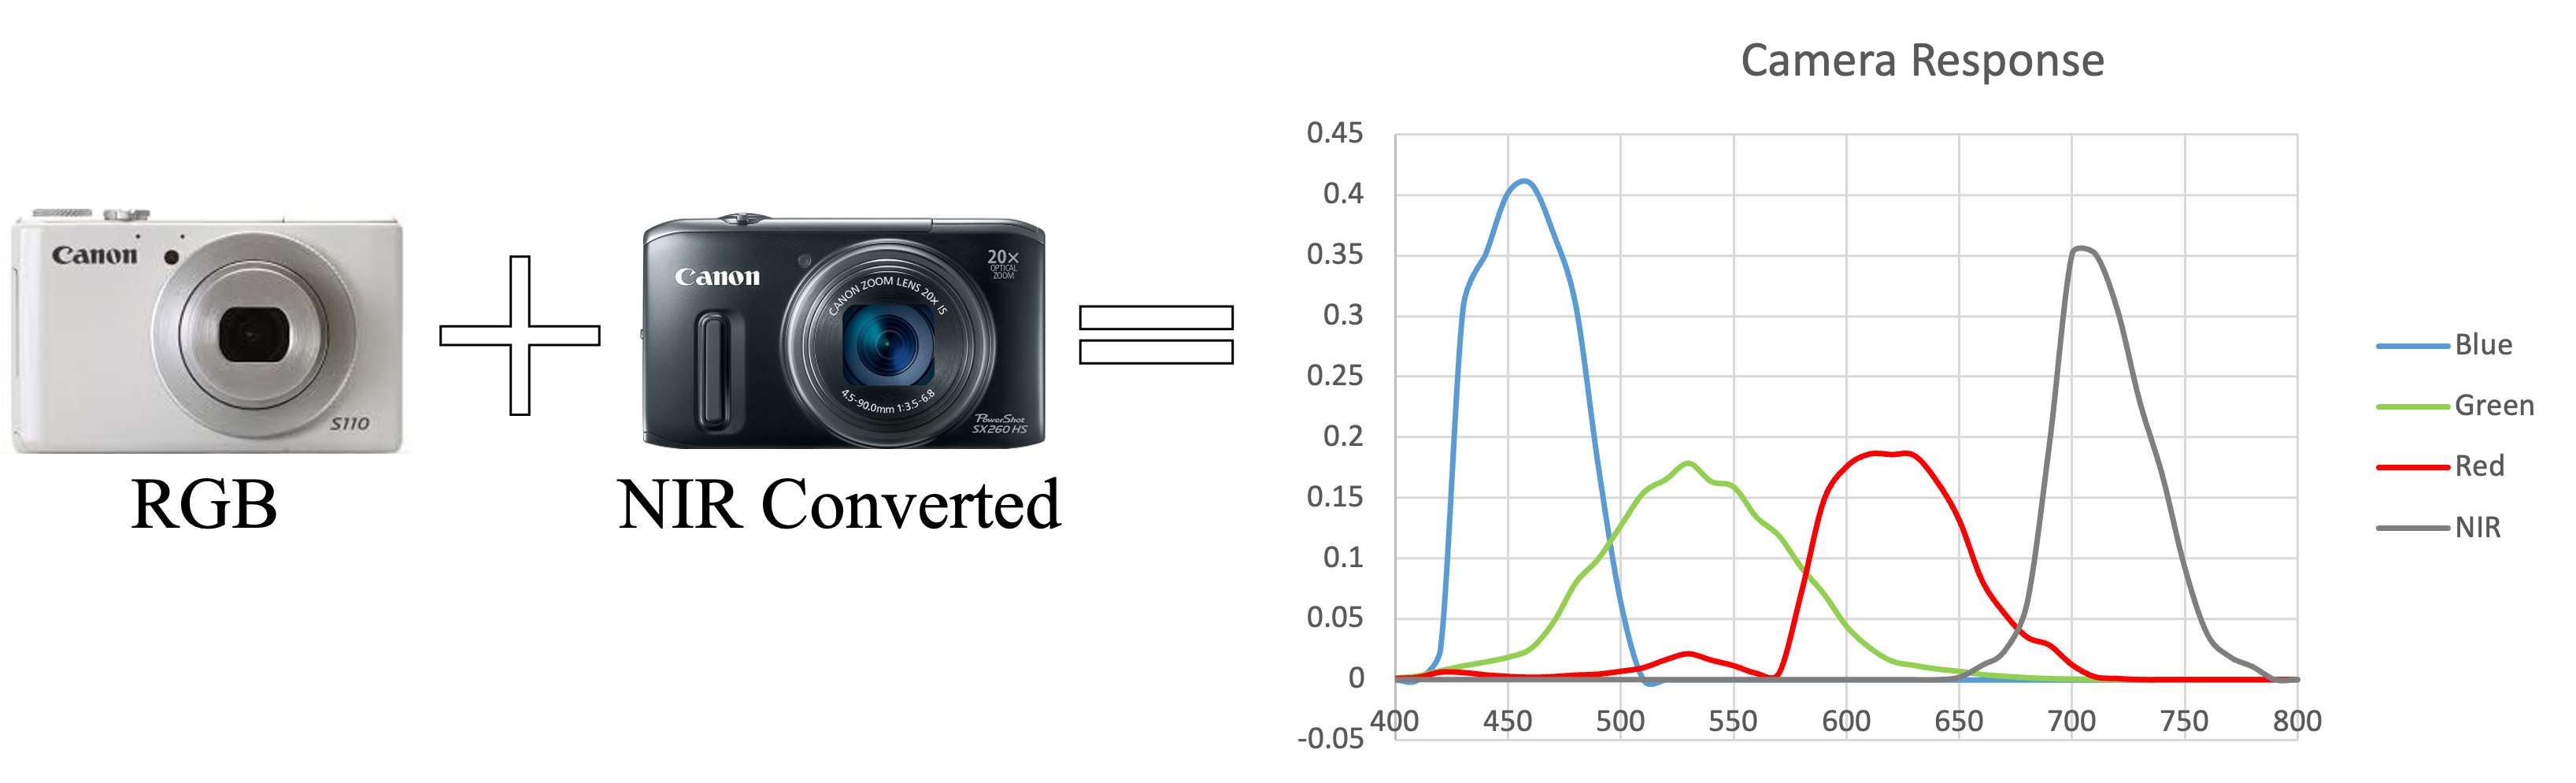
The core challenge motivating this work is the NIR-converted Canon SX260: removing the factory IR-blocking filter and adding a red-blocking filter shifts the camera’s sensitivity into the NIR band — but the resulting spectral response is unknown and cannot be inferred from specs. Empirical characterization is required.
Two cameras were mounted on the UAV platform:
| Camera | Model | Modification |
|---|---|---|
| RGB | Canon S110 | Stock (unmodified) |
| NIR | Canon SX260 | IR-blocking filter removed; red-blocking filter added |
The NIR conversion allows the SX260’s sensor to capture reflected near-infrared energy that is normally blocked in consumer cameras. However, the modified optical path creates a unique spectral sensitivity that cannot be assumed from factory specs — it must be measured.
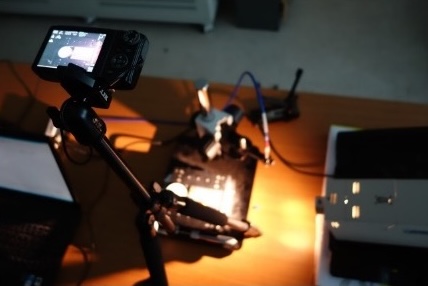
Experimental Setup
Spectral responses were identified in a lab setting by:
- Illuminating a 24-patch color checker under a stable tungsten halogen lamp
- Capturing images with both cameras under identical conditions
- Simultaneously measuring the patches’ surface reflectance with a spectrometer (known $R(\lambda)$)
Mathematical Model
We model the spectral response function $c_k(\lambda)$ of channel $k$ as a linear combination of $D$ basis functions:
\[c_k(\lambda) = \sum_{i=1}^{D} q_{k,i} \, u_{k,i}(\lambda)\] \[\begin{aligned} &\text{where} \quad k \in \{R,\, G,\, B,\, NIR\} &&\text{(image channel)} \\ &\phantom{\text{where}} \quad c_k(\lambda) &&\text{relative spectral sensitivity of channel } k \\ &\phantom{\text{where}} \quad u_{k,i}(\lambda) &&\text{basis function } i \text{ for channel } k \\ &\phantom{\text{where}} \quad q_{k,i} \in \mathbb{R} &&\text{scalar coefficient, solved by least squares} \\ &\phantom{\text{where}} \quad D = 2 &&\text{number of basis functions} \end{aligned}\]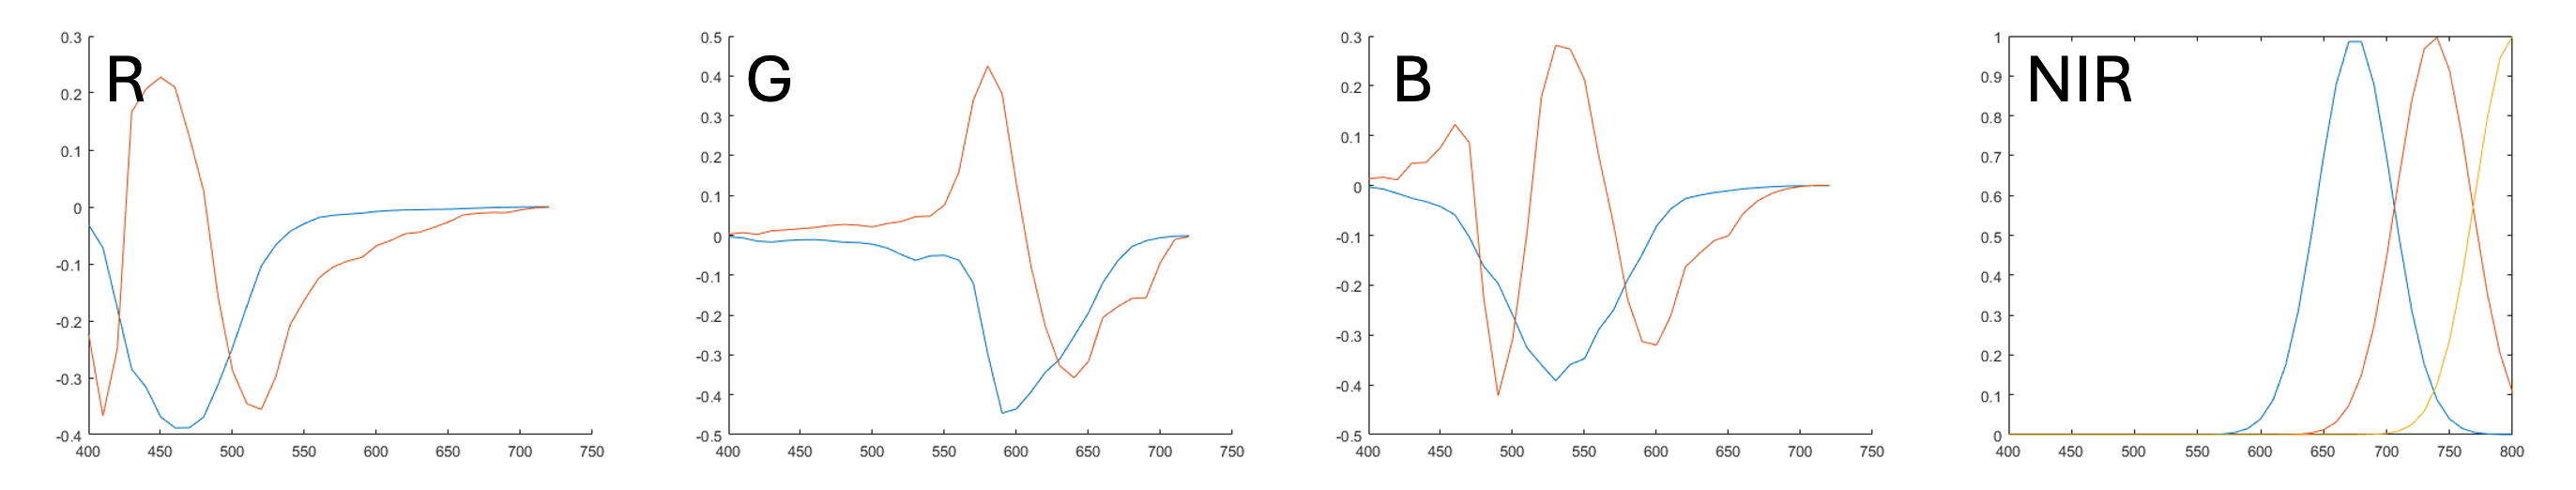
Recovering the Response Coefficients
The digital number $I_k$ for a camera channel $k$ viewing a surface with reflectance $R(\lambda)$ is:
\[I_k = \int R(\lambda)\, c_k(\lambda)\, d\lambda = \sum_{i=1}^{D} \underbrace{\left( \int R(\lambda)\, u_{k,i}(\lambda)\, d\lambda \right)}_{E_{k,i}} q_{k,i}\]Stacking all 24 color patches into a matrix system gives:
\[\mathbf{I} = \mathbf{E}\,\mathbf{q}\]Since we have 24 measurements but only $D = 2$ unknowns per channel, the system is overdetermined and solved via least squares using the Moore–Penrose pseudoinverse:
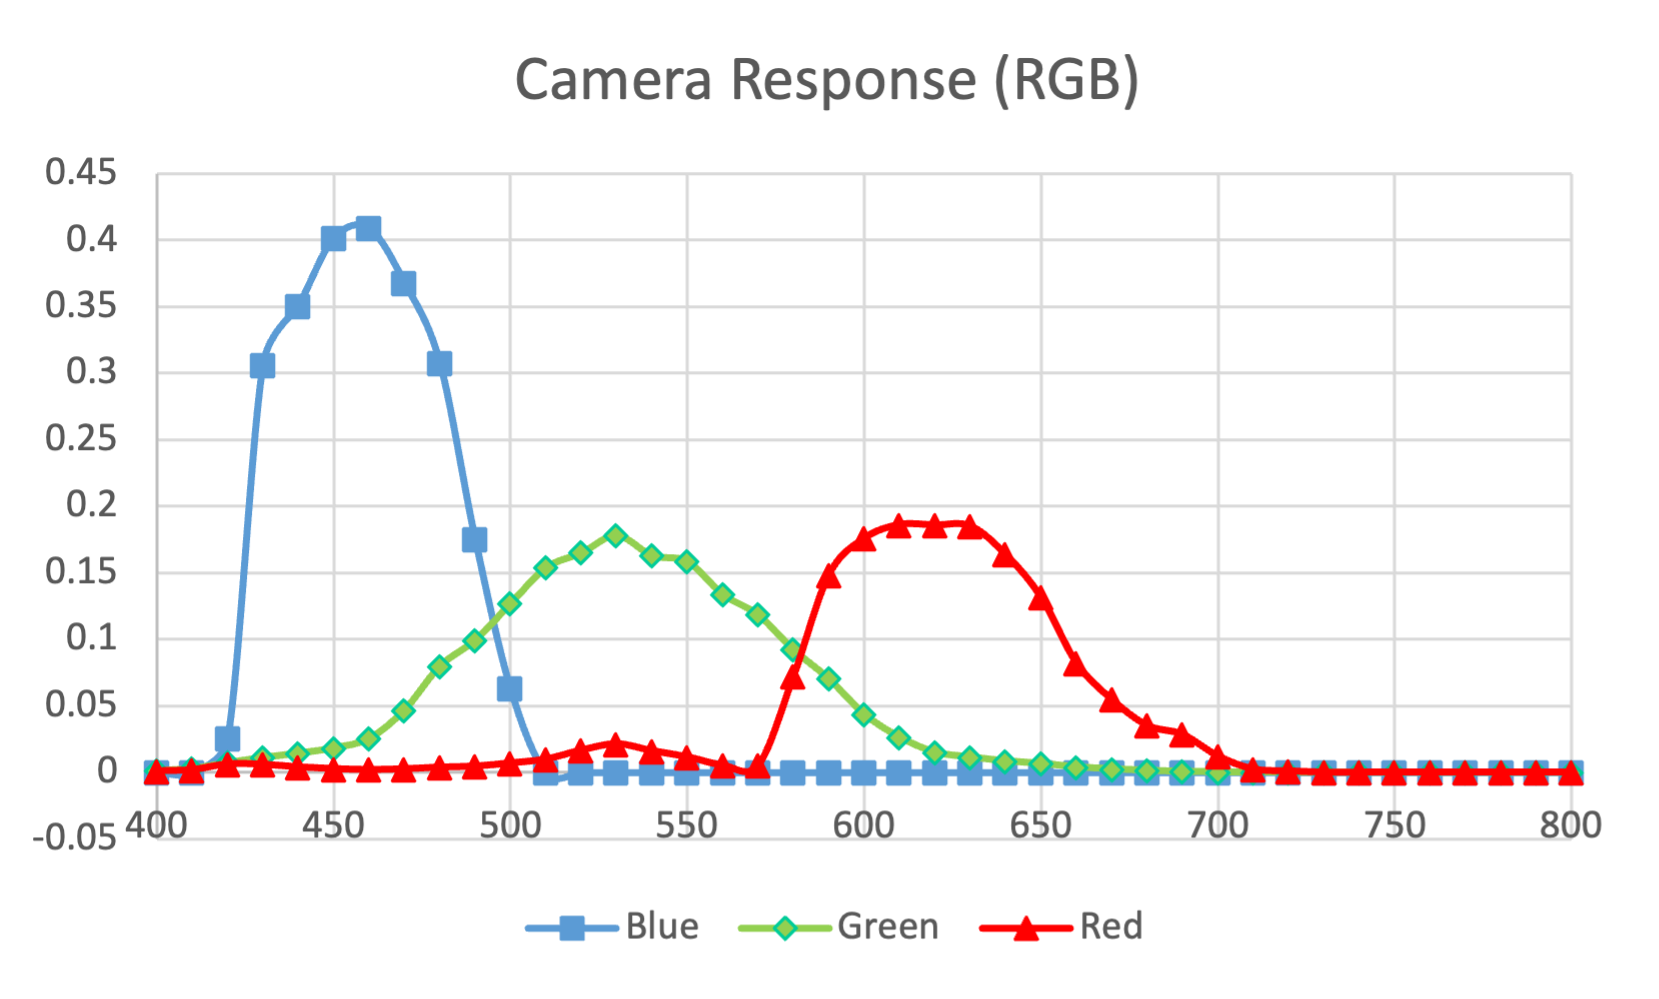
\[\mathbf{q} = \mathbf{E}^{+}\,\mathbf{I} = (\mathbf{E}^T \mathbf{E})^{-1} \mathbf{E}^T \mathbf{I}\]Results: Recovered Spectral Responses
2. Radiometric Calibration of UAV Images
UAV Platform
Field data was collected with a DJI F550 Hexa-rotor equipped with a 3DR Pixhawk autopilot. The dual-camera payload (RGB + NIR side by side) was mounted in a nadir-facing gimbal for consistent ground coverage.
Ground Reference Panels
Before each flight, calibration panels covering a wide reflectance range were laid on the ground within the image footprint.
The panels’ full spectral curves $R_x(\lambda)$ were measured by spectrometer, shown below:
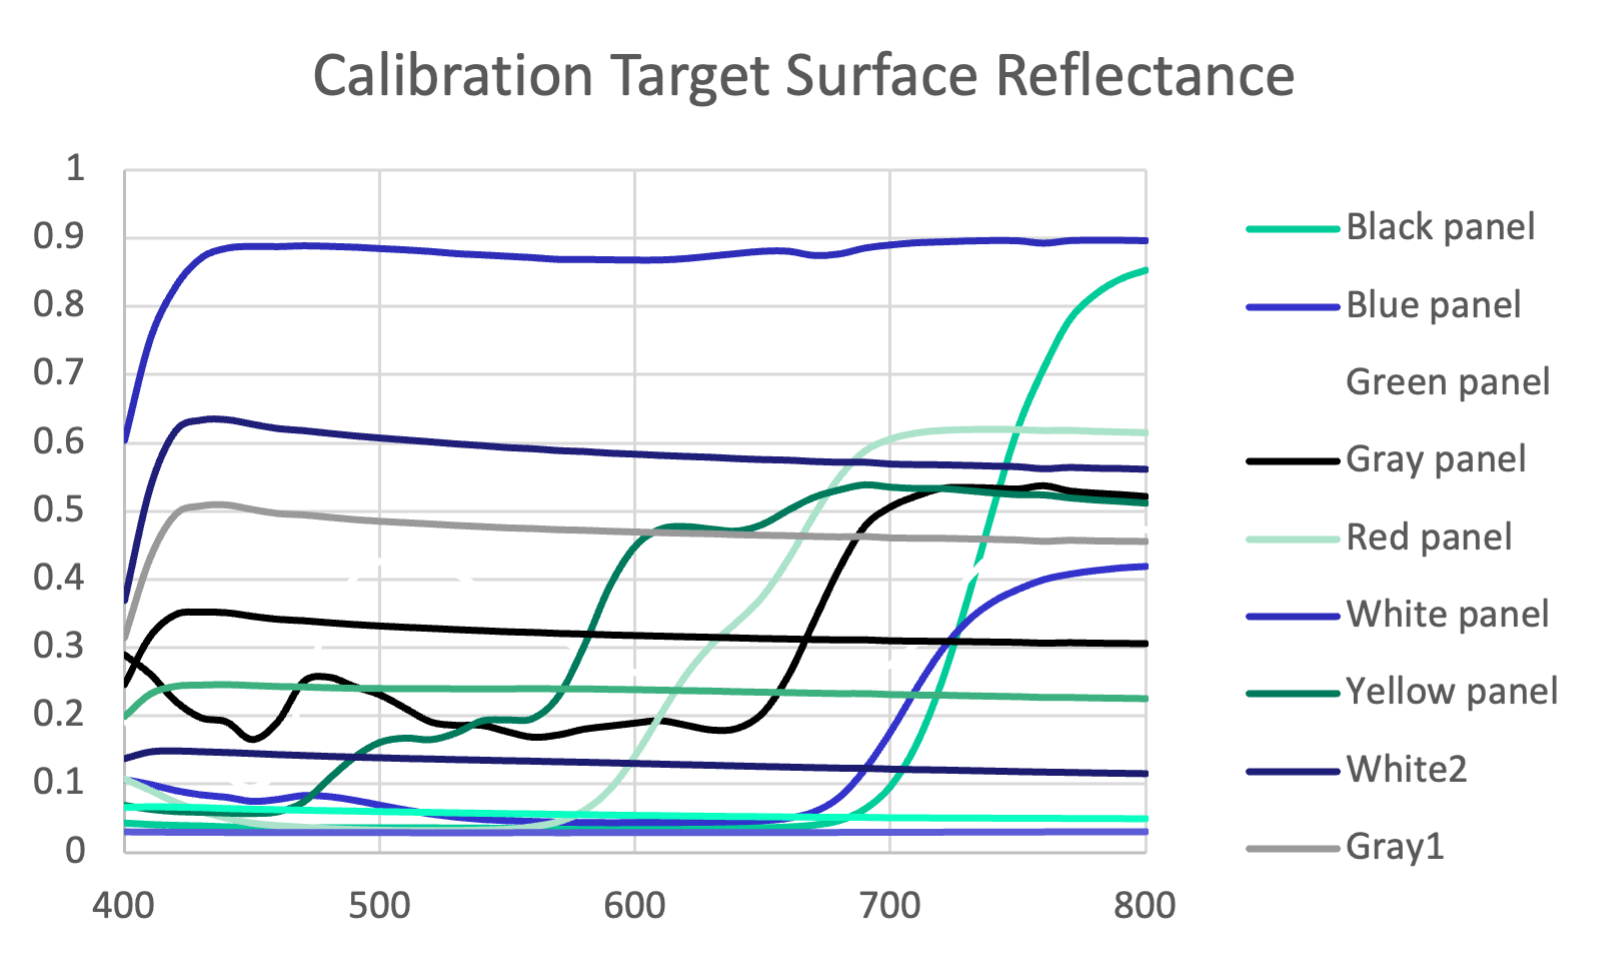
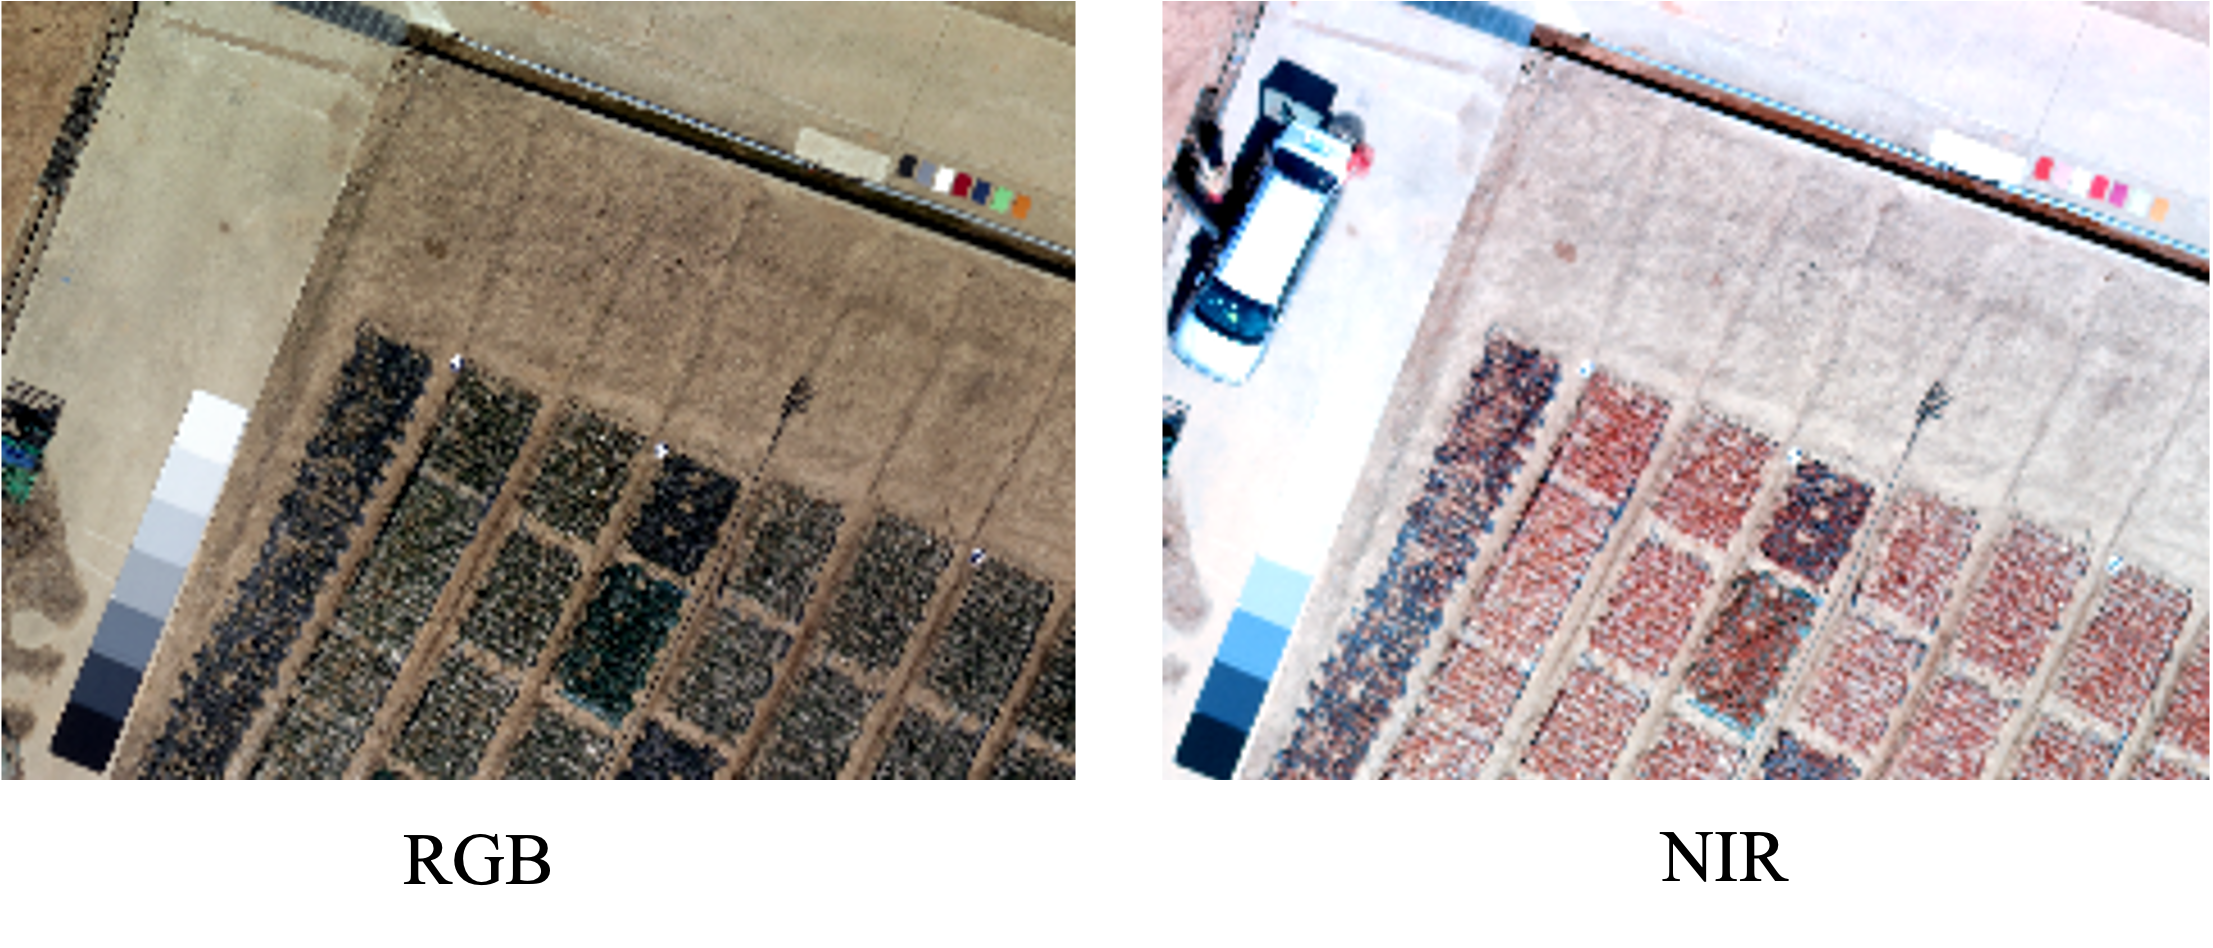
The panels are clearly visible in both the RGB and NIR UAV images below:
Band-Weighted Reference Reflectance
Using the recovered camera responses $C_k(\lambda)$, we compute the expected reflectance that each channel “sees” for each calibration panel $x$:
\[r_{x,k} = \frac{\displaystyle\int_{400}^{800} R_x(\lambda)\, C_k(\lambda)\, d\lambda}{\displaystyle\int_{400}^{800} C_k(\lambda)\, d\lambda}\]This band-weighted value accounts for the fact that the camera channel averages reflectance over a range of wavelengths, weighted by its own sensitivity curve — not a simple wideband average.
Calibration Curves: DN → Reflectance
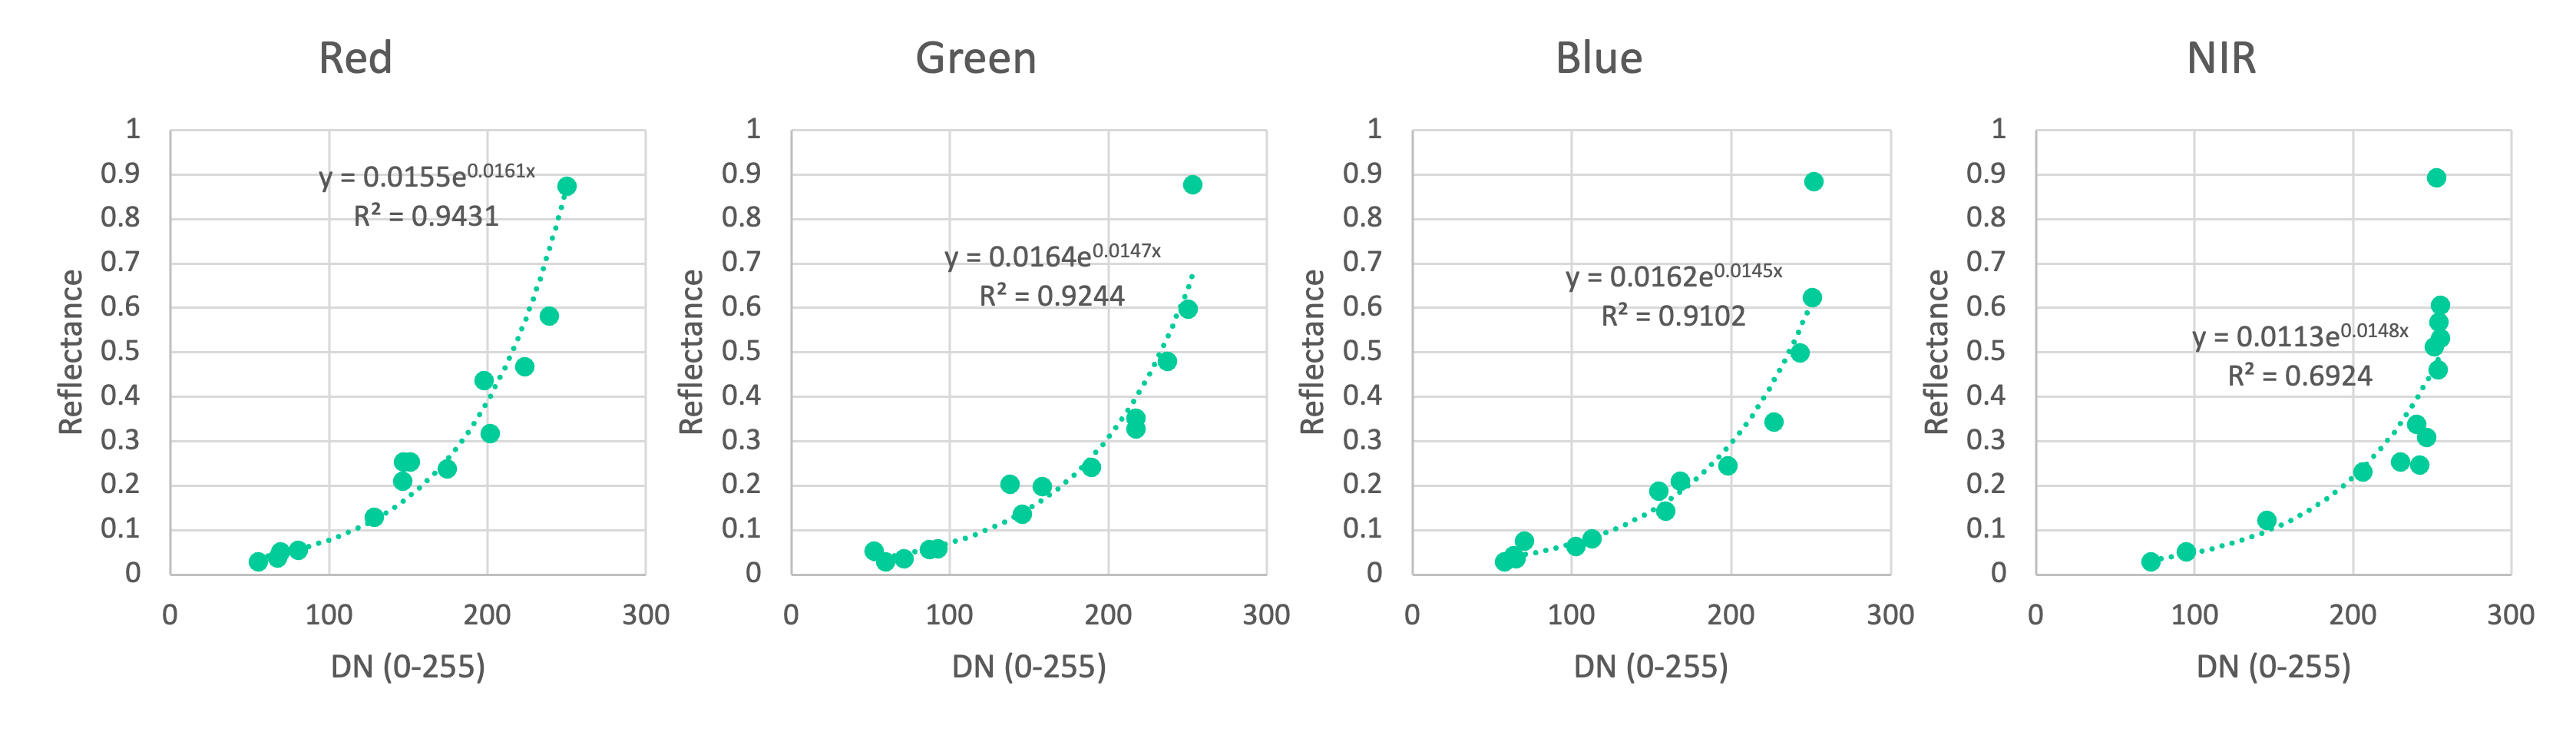
The observed DN values from the panel pixels in the UAV image are paired with the computed $\vec{r}_{x,k}$ values. Fitting an exponential model $\rho = a \cdot e^{b \cdot \text{DN}}$ to this scatter yields the per-channel, per-flight calibration function:
3. Findings & Conclusion
Key takeaways from the calibration analysis:
- Saturation must be handled explicitly. Panels with DN > 240 drove outliers that distorted the calibration curve; excluding them was essential.
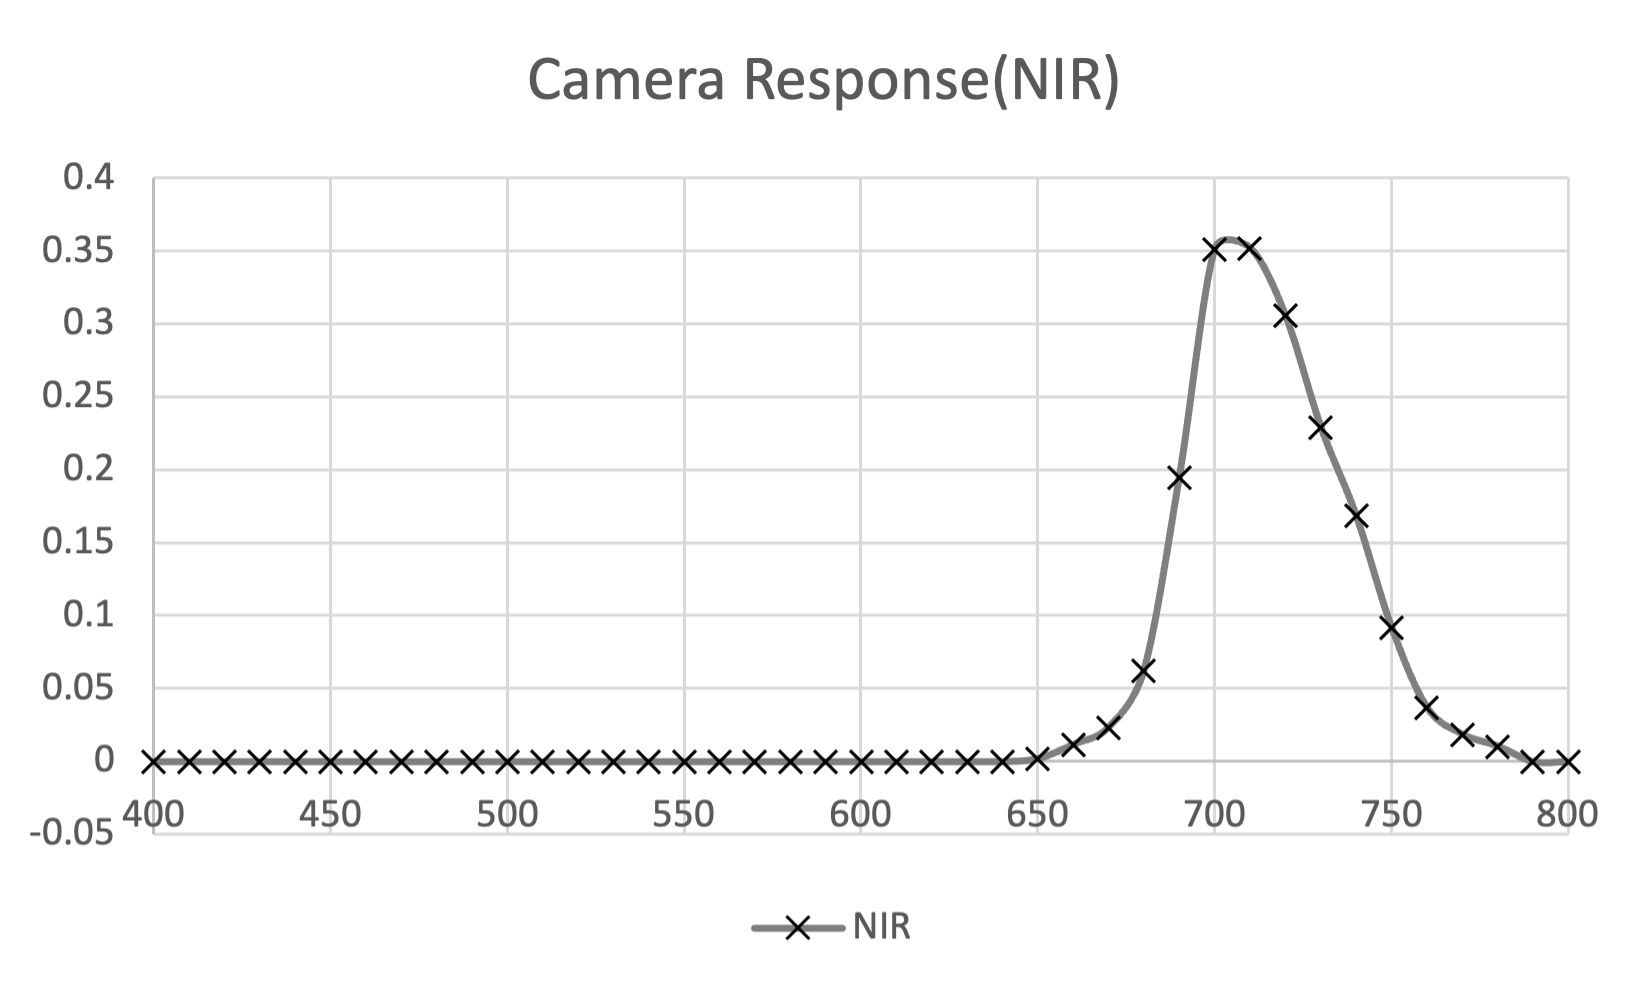
- The basis-function approach is compact and effective. $D = 2$ functions were sufficient to recover smooth, physically plausible spectral responses for both cameras.
- Camera-specific response curves matter. Assuming a generic Bayer response for the NIR-converted SX260 would significantly misrepresent its sensitivity, leading to systematic reflectance errors.
- Exponential DN–reflectance mapping. The nonlinear camera response is well-described by an exponential model across the 8-panel reflectance range (3–90%), with fits ranging from $R^2 = 0.69$ (NIR) to $R^2 = 0.94$ (R).
Together, these results validate a low-cost, physically principled path for turning consumer cameras into quantitative remote sensing instruments suitable for agricultural applications.
References
- Jiang, J., et al. (2013). “What is the space of spectral sensitivity functions for digital color cameras?” IEEE Workshop on Applications of Computer Vision (WACV).
- Hunt, E. R., et al. (2010). “Acquisition of NIR-green-blue digital photographs from unmanned aircraft for crop monitoring.” Remote Sensing, 2(1), 290–305.
- Hakala, T., et al. (2013). “Direct reflectance measurements from a UAV: sensor absolute radiometric calibration and system tests for forest reflectance characterization.” Sensors, 13(4), 5170–5192.
BibTeX
@inproceedings{yun2016radiometric,
  title     = {Radiometric Calibration and Vegetation Index Analysis of Upland-Crop UAV Images},
  author    = {Yun, Heesup and Jung, S. J. and Kim, H. J.},
  booktitle = {Proceedings of the 2016 KSAM Spring Conference},
  year      = {2016}
}