Measuring Forest Evapotranspiration: From Leaf Weight to Water Flux
Evolution of a Research Project: Understanding Forest Water Flux
Research often starts with a specific technical goal that reveals a much larger scientific context upon reflection. This was certainly the case for my work on developing an automated weight monitoring system for forest floor debris.
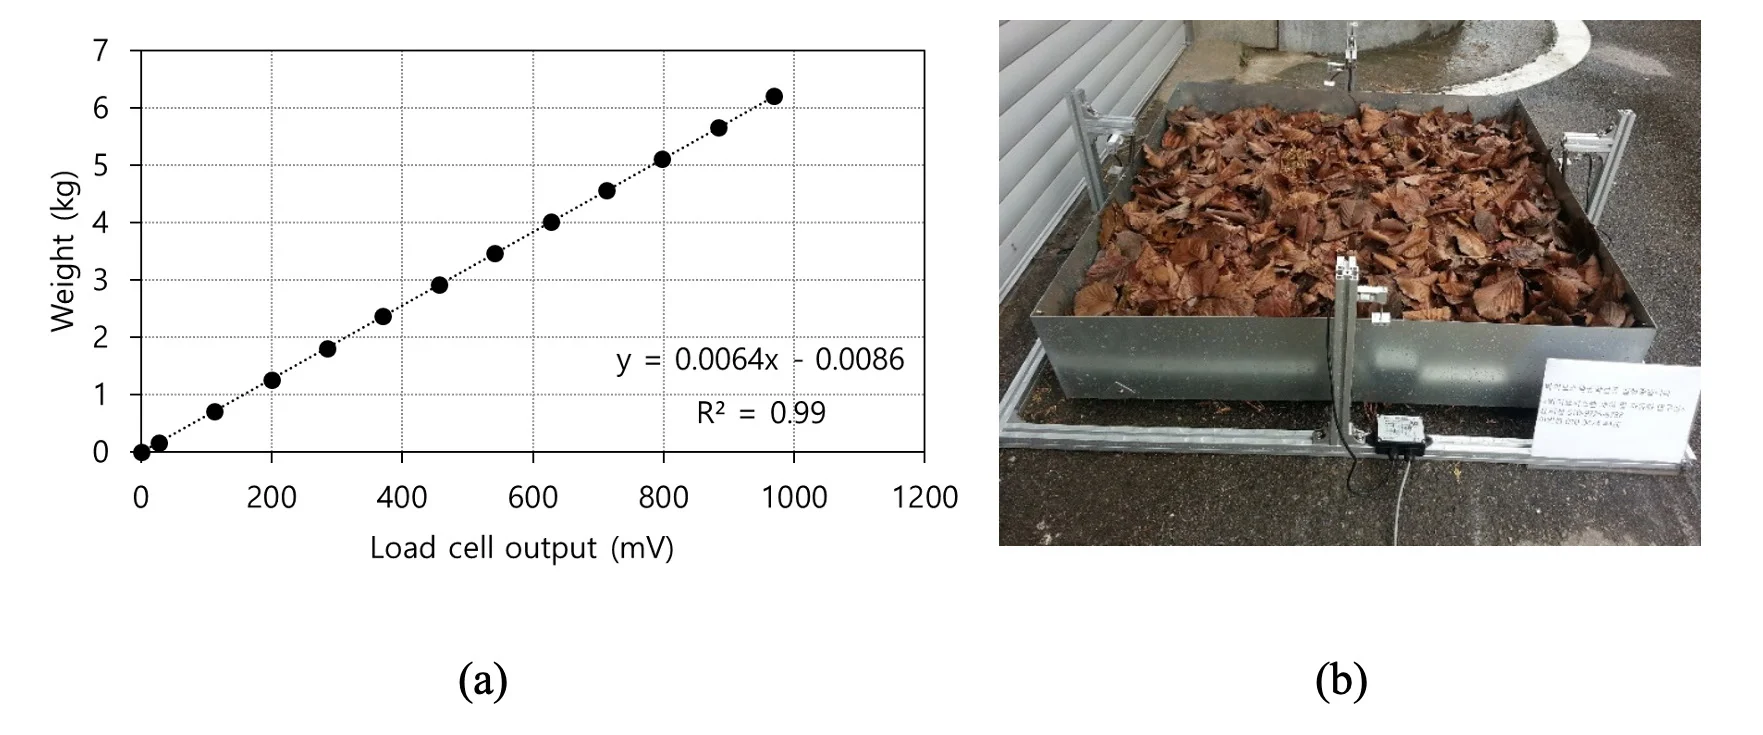
Initially, I viewed this project through a narrow lens: building a 1x1 meter grid to measure the real-time weight changes of dead leaves in a research forest. The primary goal was to monitor fuel moisture content (FMC), a critical factor in wildfire risk assessment. However, looking back at the experimental setup, I realize its broader significance.
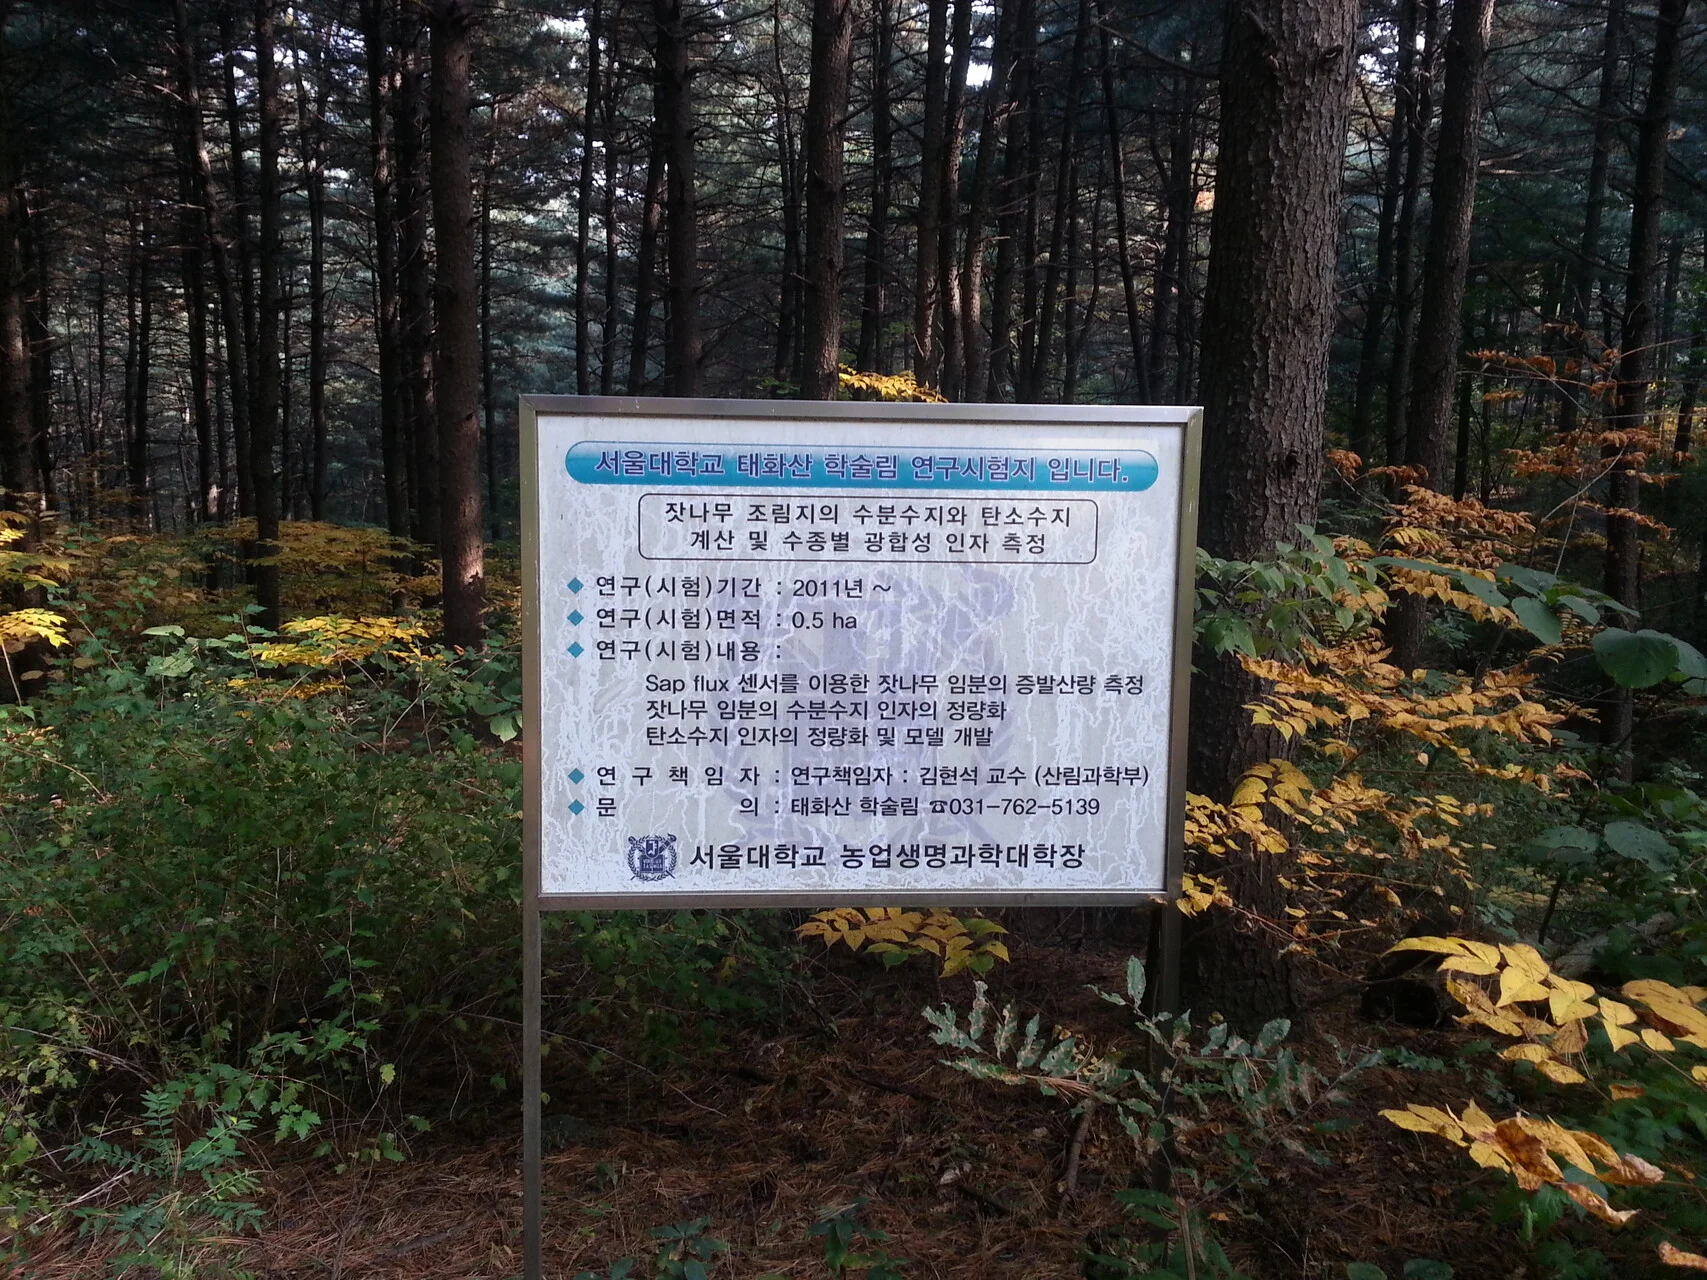
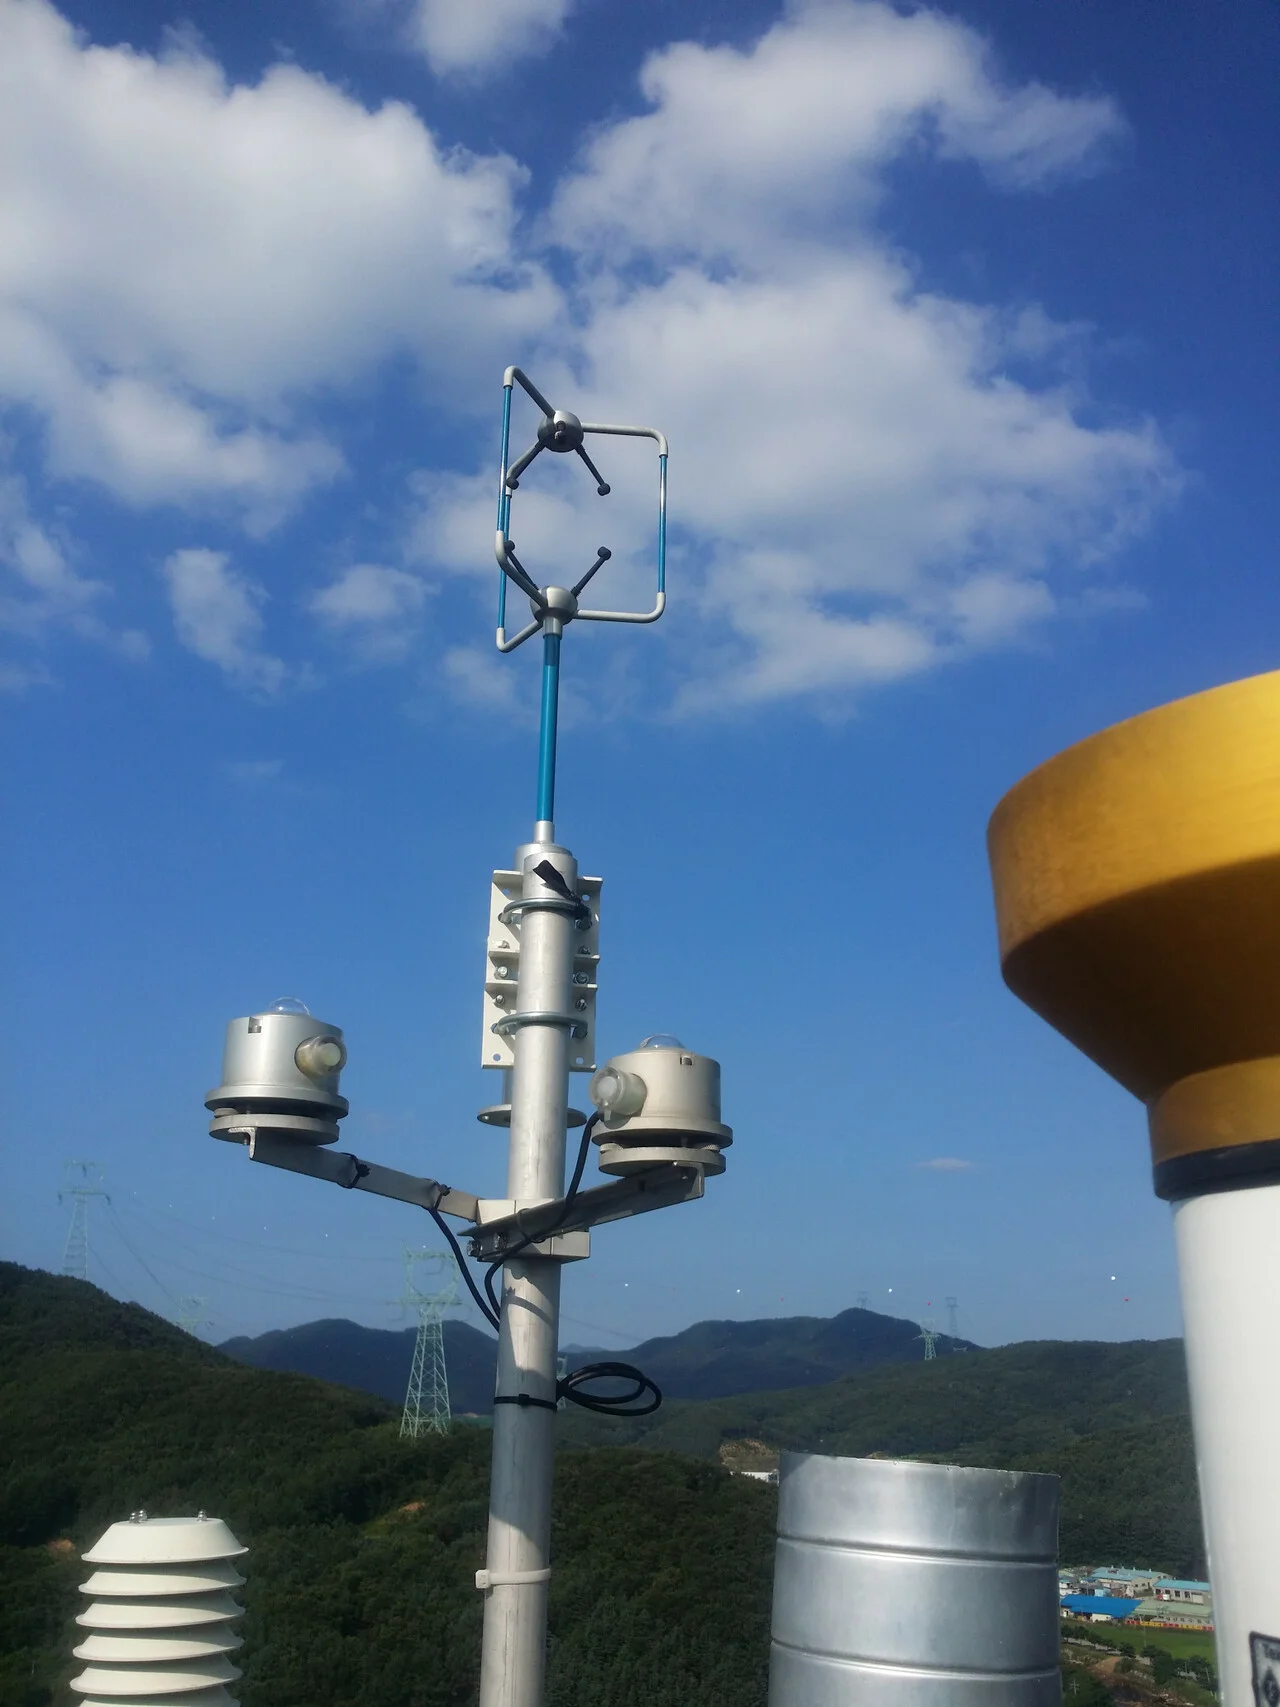
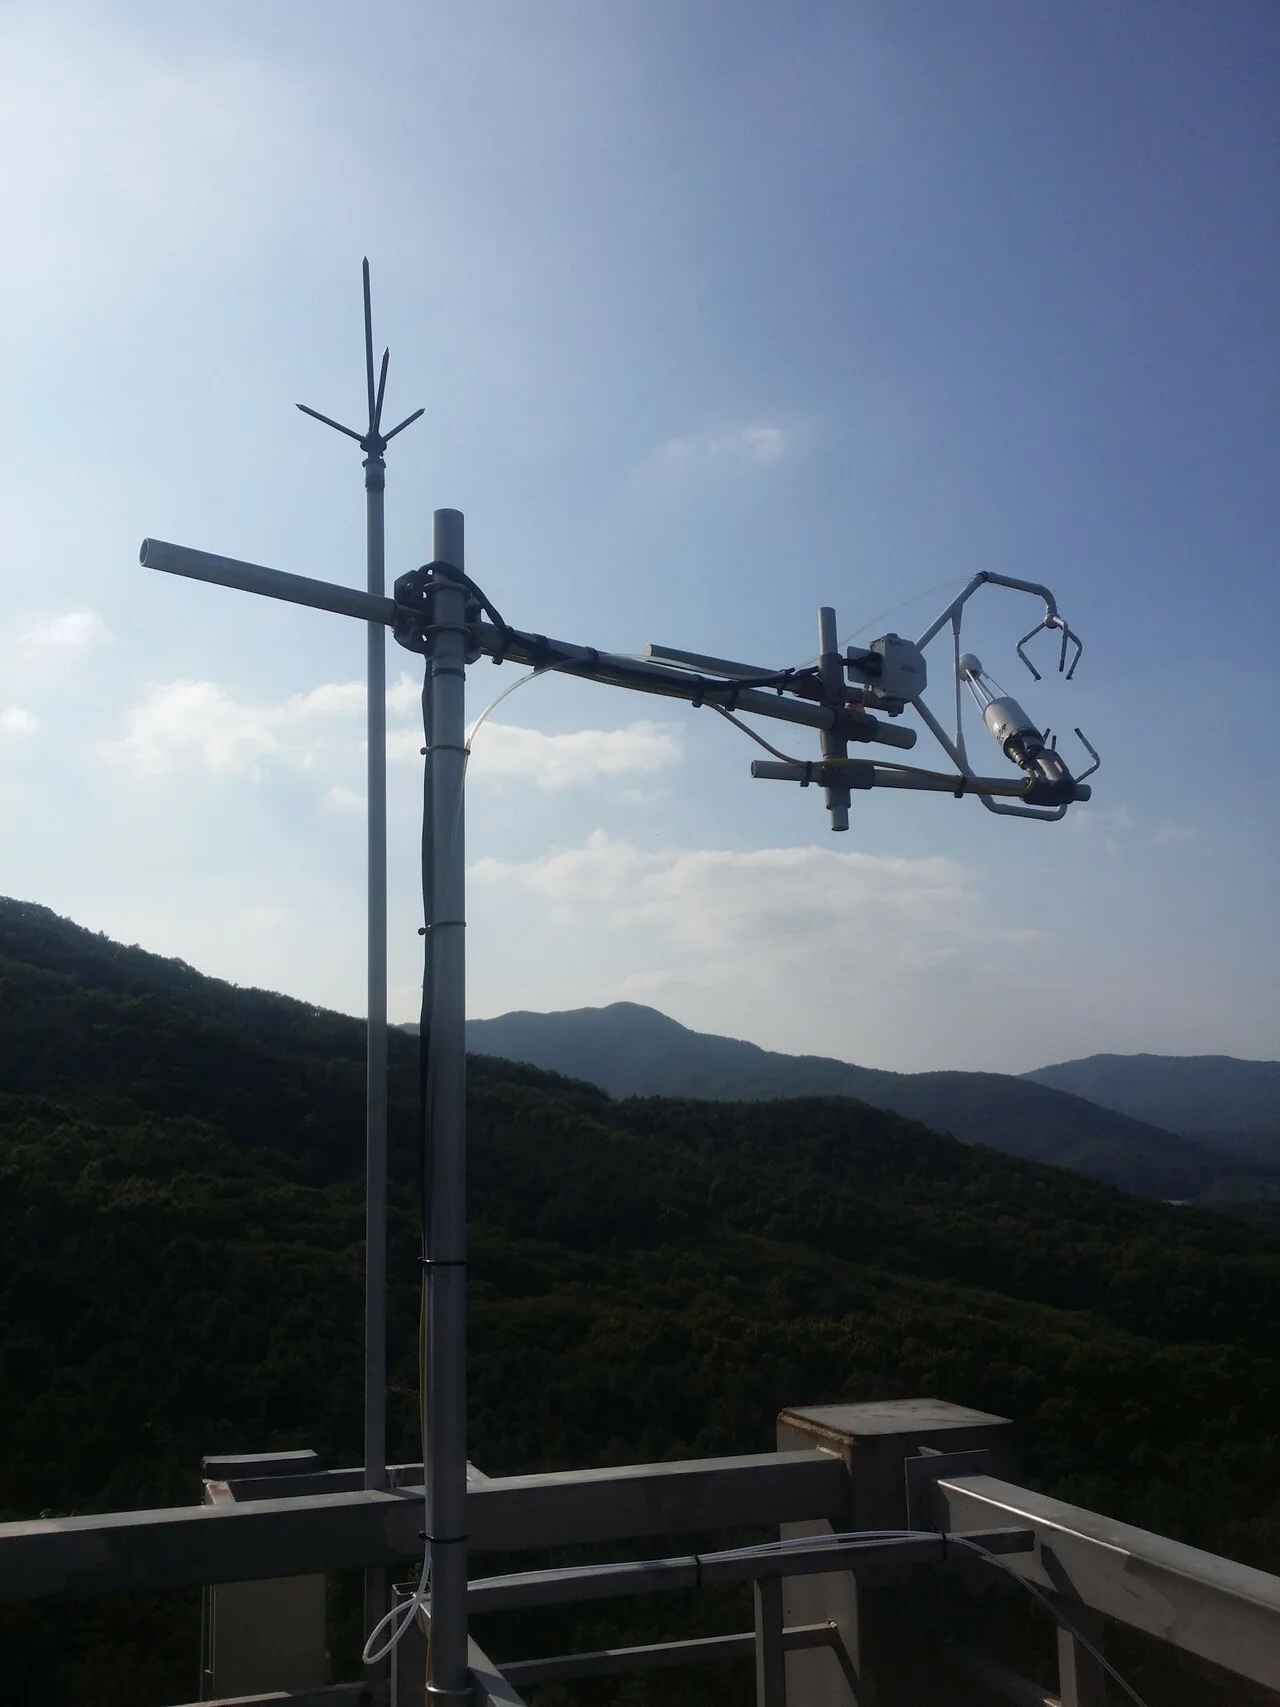
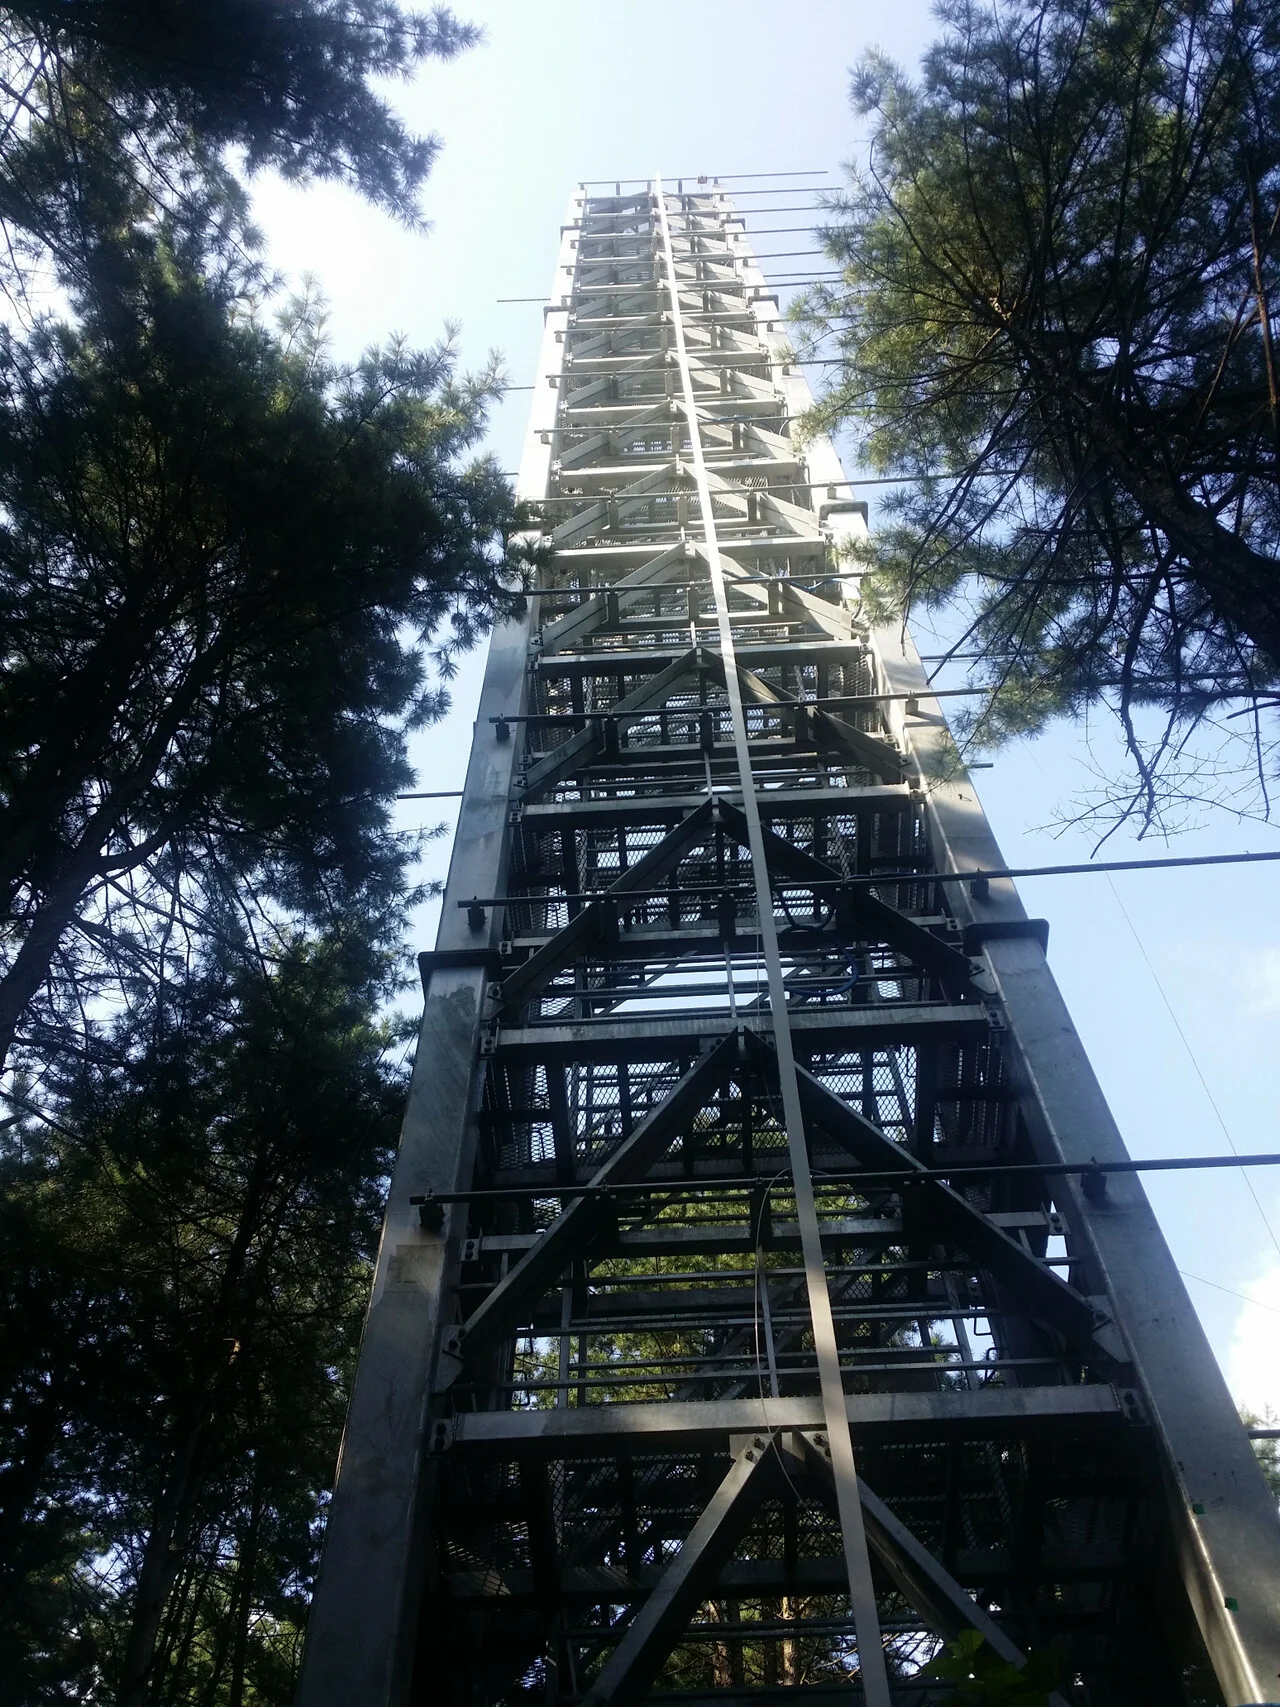
The installation was strategically positioned near an eddy covariance tower. While the load cells were measuring the “input” and “output” of water in the leaf litter (through precipitation and drying), the tower was measuring the surrounding atmospheric exchanges. Together, these tools provide a comprehensive look at evapotranspiration (ET) rates and the overall water flux within the forest ecosystem.
Technical Implementation
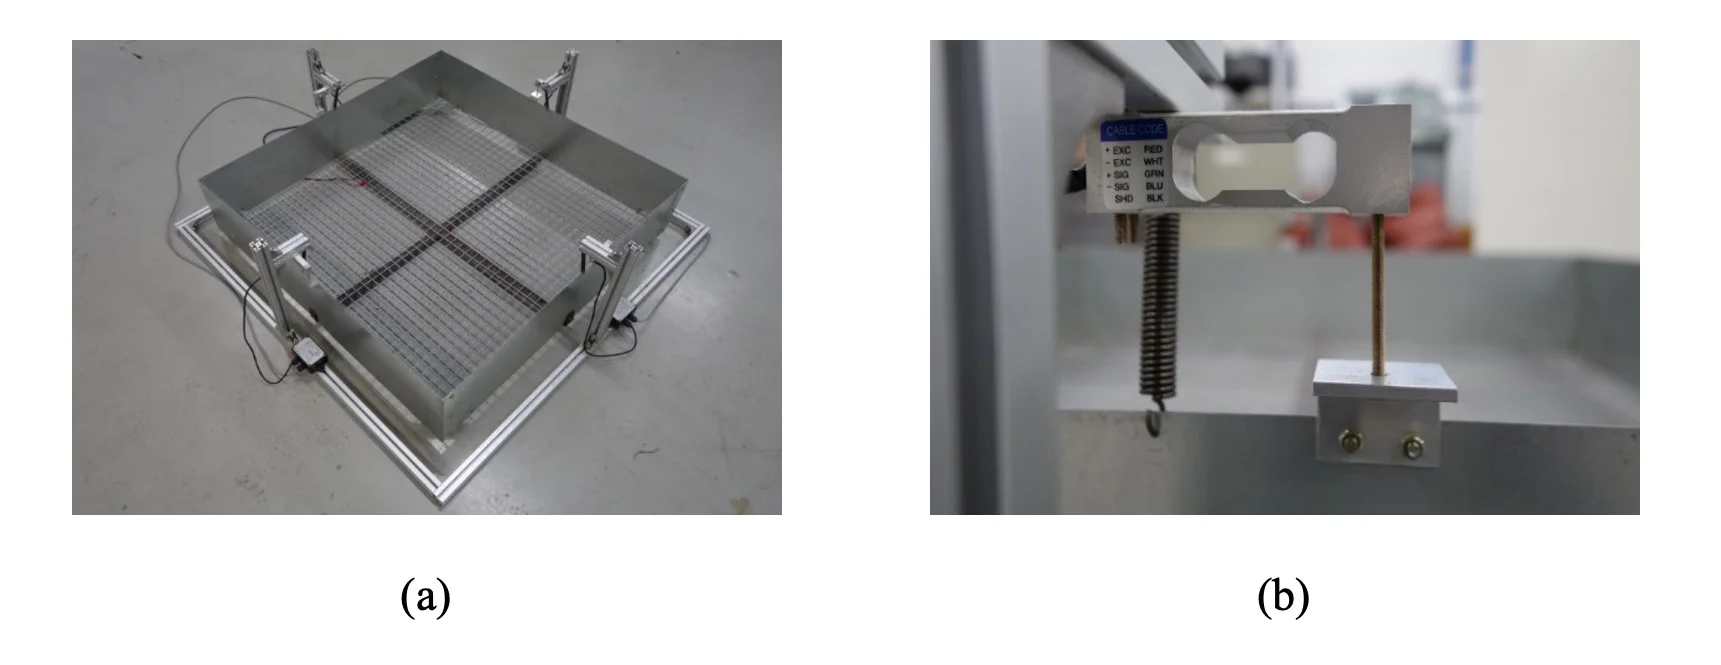
The system was designed to provide continuous, high-resolution data in a harsh outdoor environment. At its core, the system uses load cells to track the mass of a 1m x 1m aluminum container filled with leaf litter.
Hardware Architecture
- Sensors: Four 5 kgf-class load cells (BCL-5L, CAS, Korea) arranged to support the weighing platform.
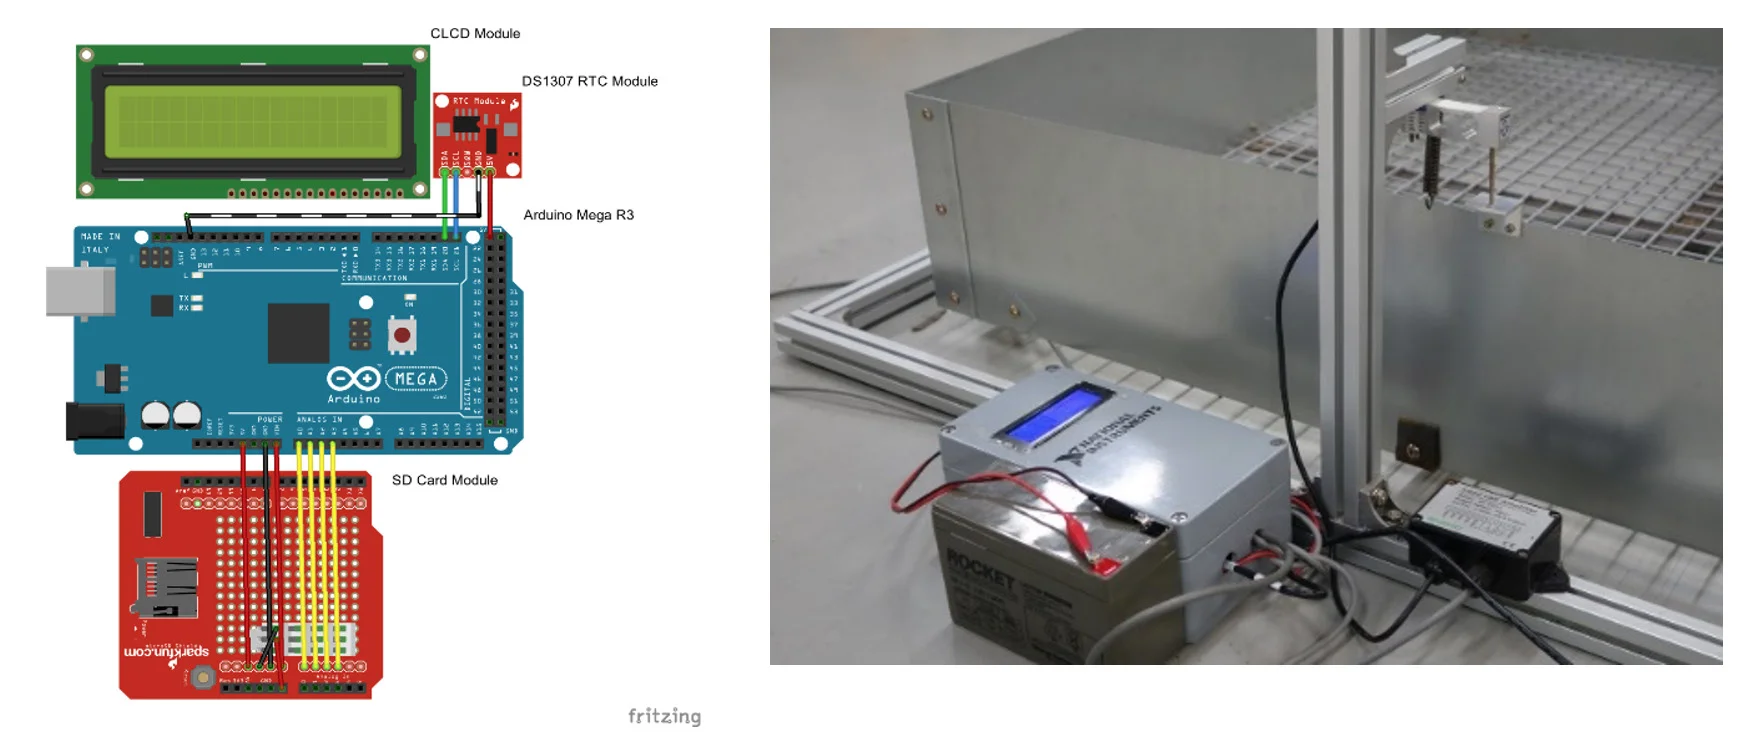
- Microcontroller: An Arduino Mega R3-based embedded system.
- Signal Processing: 16-bit analog-to-digital conversion to ensure precision in detecting minute weight changes.
- Data Logging: Local storage via SD card module and a real-time clock (RTC) for timestamped measurements.
Field Results and Observations
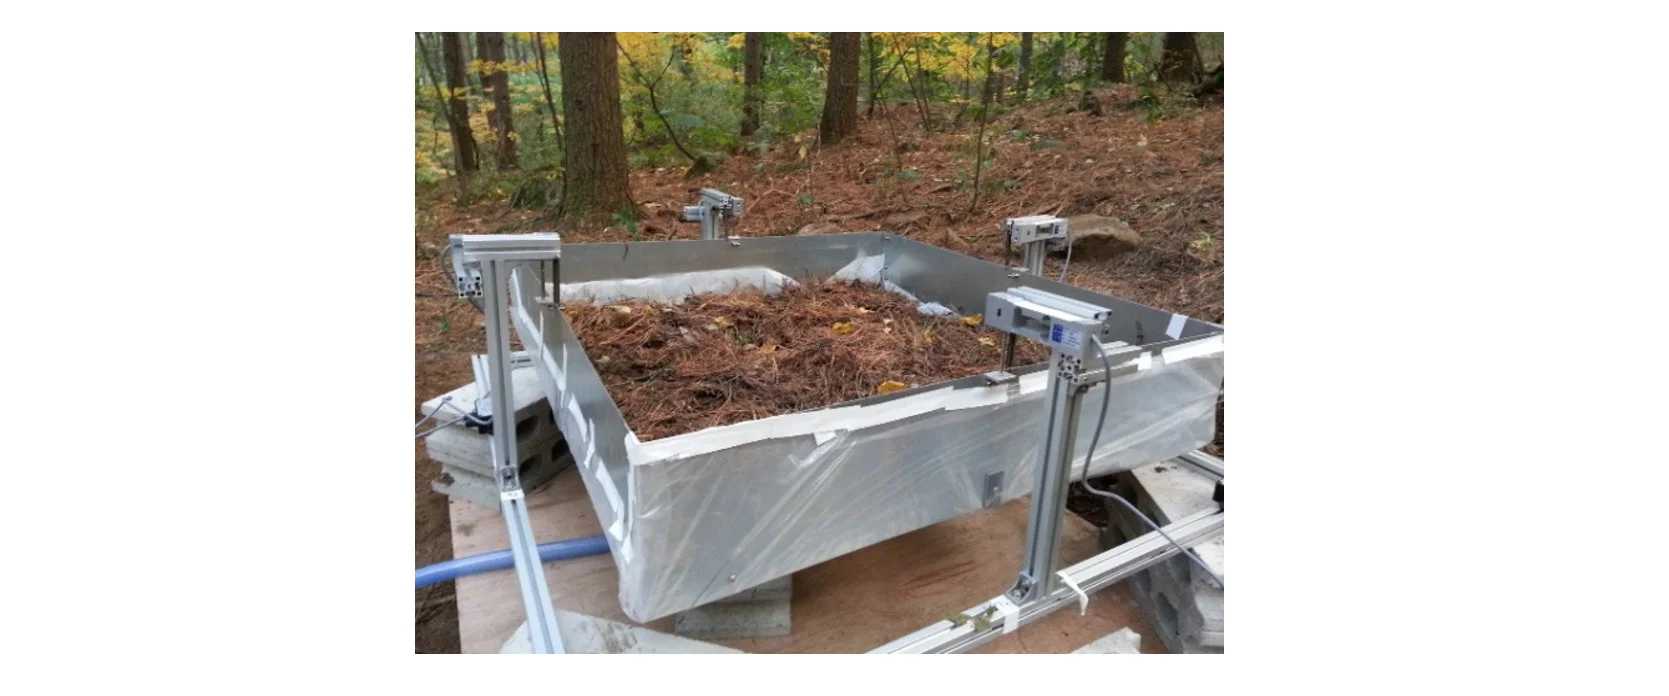
The system was deployed in an experimental forest to monitor how leaf weight fluctuates with environmental conditions. The most striking results come from comparing the leaf weight data against precipitation events.
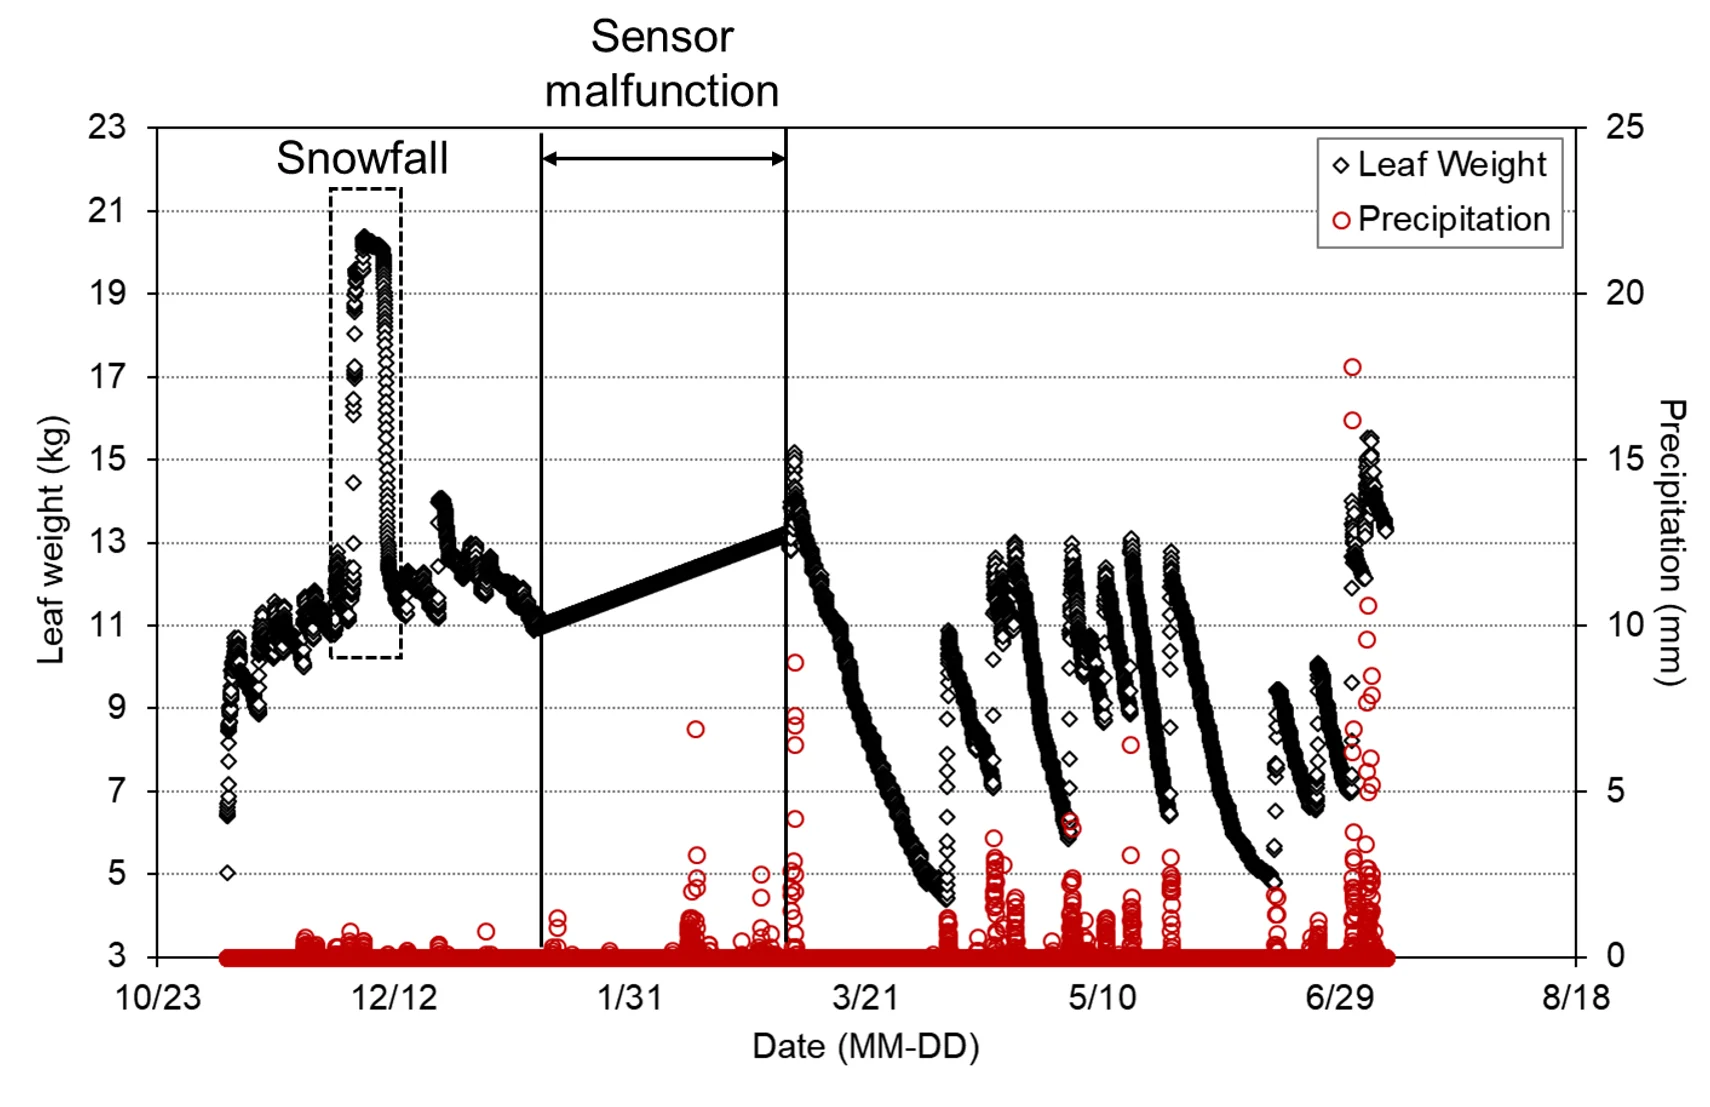
As shown in the graph above, the weight of the dead leaves increases sharply during rain and then follows a distinct drying curve. By quantifying this drying rate near an eddy covariance tower, researchers can better understand the forest surface’s contribution to total evapotranspiration, a key variable in both climate modeling and forest fire prevention.
BibTeX Citation
@article{yun2020development,
  title={Development of an in situ Dead Leaf Weight Monitoring System},
  author={Yun, Heesup and Kim, Hak-Jin and Cho, Woojae and Kim, Hyun-Suk and Lim, Sang-Joon},
  journal={Precision Agriculture Science and Technology},
  volume={2},
  number={3},
  pages={182--188},
  year={2020},
  publisher={Korean Society of Precision Agriculture}
}